Part 1: Capacity Market – Lipstick on a Pig
“The desire for safety stands against every great and noble enterprise” Tacitus
Please ponder the above quote from a Roman philosopher. This quote applies to many things beyond this discussion of capacity markets in the power sector.
PJM is making a drastic change in its capacity model. This is a two part article with the first part covering the creation of the capacity market. I believe if you understand how you got to where you are now, you will be better equipped to reflect on the future. Part 2 will go over the issues in the new PJM proposed capacity market.
History of Capacity Markets
Unfortunately, an analysis on the capacity markets cannot be examined without a discussion of regulation vs. de-regulation. To many, this is akin to discussing politics, race, and/or religion. I will attempt to stick with the facts and avoid absolutes.
In a regulated world, there is no need for a capacity market as investments are made once the utility shows to the utility commission the investment is prudent to meet a certain loss of load probability requirement. In a perfect world, the commission, interveners (industrial lobbyist, consumer protections groups), and the utility produce some reasonable acceptance to the need of generation capacity and then, and only then, does generation get built. In return for this consensus opinion, the utility is protected from a loss if the generation is not needed in the future. At the same time, the utility is capped in its earning potential.
However, this regulated system does come with some cost as previously discussed in my Regulation vs. De-Regulation article. A regulated system does not bode well for adoption of new methods and technology. The system is focused on maintaining. Overtime cost can rise without proper oversight from the commission. As I noted in a previous article, this is likely inevitable given the poor levels of compensation in the commission. In my latest research, the Ohio public utility commission earns between $75-$160K per governor approval. This is a full time job as commissioners are not only regulating electric utilities but also natural gas, telephone, water, railroad, and motor carriers.
Within the electric sector, they are dealing with the executives making multi-million dollar salaries each year. Then the senior management team earns around $500K with directors making $130-300K. You have analysts coming out of college in the utility, potentially, making more than the commissioners and their staff. With this design, it is no wonder the effectiveness of regulation would wane. It is certainly reasonable to expect commissioners and staff to have the potential desire to work at the utility in order to support their families. This very fact could make it hard for some to really clamp down on their potential employer. Please note none of my statements are absolutes nor are they confirmed in anyway with current commissioners or staff. I use my practical insights on human behavior to potentially deduce these outcomes along with past history. There has been confirmed revolving door in the electric utility space as in the Duke Energy Corp case where the chief legal counsel for the states utility regulatory agency joined Duke Energy Corp after presiding on two cases favorable to Duke. I strongly suspect, if he ruled unfavorably in the cases, he might not have had the job.
The history of poor regulatory decisions led many to investigate the de-regulation option vs. fixing the regulatory process through increase budget to source and retain skilled and experience commission and staff. Ideally, competition will drive the inefficiencies out of the market that the regulatory body could not. Theoretically it made sense given poor decisions were not being punitive as in a free market and the drive for innovation was not there as there was no earnings potential beyond a set return. Both of these points still could have been somewhat managed by the regulatory agencies. Another bonus of de-regulation many touted was allowing greater transparency and market discovery which would potentially allow new companies to innovate and capture the market thereby reducing society cost. De-regulation would drive the inefficiencies out of the market and the innovative nature of competition will drive the cost down further. It all sounds so good on paper.
Markets became de-regulated with California leading the way. We all know what happened there. The first market inefficiency they attacked wasn’t the inefficient operation of the utility but the inefficiencies of the market model – Enron Strategy. To me, this highlights that the inefficiency of the utility really isn’t that large compared to the inefficient market designs. If you think this was resolved due to the experience in California – think again. In 2010 JP Morgan hired John Howard Bartholomew. He wasn’t hired to progress the electric industry nor drive out inefficiencies in the utility but to find the inefficiencies in the market design. Once again they quickly identified inefficiencies and targeted those arbitrages to the benefit of themselves. A regulated entity would have not done that given the lack of incentive. However, these free market players realize there is more money in market manipulation than the boring optimization of power plant supply chain. In addition, the risk from getting “caught” still produces a decent return on investment after accounting for the penalties.
As an outcome, many deregulated markets kept a price cap to “protect” the consumer. PJM price cap is at $1000/MWh. ERCOT is having to raise their price cap as they stayed on the moral high ground on de-regulation and continued without a capacity market. The one thing ERCOT is doing is raising the market price cap from $2,500/MWH (2011) to $9,000/MWH (2015) in order to incentivize generation build. To prevent a market brownout or blackout, demand must be met even in the one instantaneous moment of ultra-high demand. Typically, power planners will build peakers to run for those given moments. However, in a free market system, they need to have enough revenue during those small times to make up for the cost of building the unit. Therefore, if your peaker cost you 85 million dollars for 85 MW and you only ran 40 hours in the year in order to have a payback in 3 years without any discounting you would need prices to average over $8300/MWh PLUS variable cost during those 40 hours. Variable cost can be over $100+/MWh given rise in fuel prices in extreme times. ERCOT is running the grand experiment to drive new technology and new methods through price incentives – the quintessential mechanism of a free market. It is just math. A market with regulation typically gets a return on investment between 8-12%. If the market is free to compete, the risk is increased. Therefore, the reward needs to increase above the regulated return requirements. The returns will likely need to grow to over 15+% rate of return. The means to this return, I contend, is too great for society. I do agree the potential for a more efficient market is very possible with an open market, but society and potentially the oversight body is not willing to take the means needed to achieve the ends of a more efficient market.
Other Regional Transmission Organizations (RTO) realized the incentive to build generation with power prices alone did not meet their historical comforts of market reserve margins and consumer pricing. They became concerned about the customer backlash to the de-regulated market, if they could not deliver the same comforts of a regulated market. The capacity market was born to hide this issue while still touting the free market solution as the answer to society’s needs. PJM came out with Reliability Pricing Model (RPM). RPM creates another layer of payment beyond the price of power. In theory, it is the value of having capacity available to serve load. Payment is based on the size of your capacity offer. The initial model was opened to all sorts of capacity options from coal plants to non-generating capacity from demand response aggregators. This model still offered some innovation by just targeting the peak demand and not putting so many strings to the participation in the auction. At this point I still believed there was a possibility to obtain the promise savings of de-regulation.
However, the latest proposal to modify RPM by PJM goes against the “free” de-regulated concepts of free market competition. The proposed RPM is likely losing all the value of being de-regulated compared to regulation. Stay tune for your early Sunday release as we detail the latest PJM PRM proposal in Part 2 Capacity Market – Lipstick on a Pig.
Your Willing to Step Out of the Box Energy Analyst,
David
David K. Bellman
All Energy Consulting LLC- “Independent analysis and opinions without a bias.”
614-356-0484
[email protected]
@AECDKB
blog: https://allenergyconsulting.com/blog/category/market-insights/
OPEC Decision Expected and Justified
OPEC meeting went as expected. There was no formal agreement to cut production in the first meeting since the price correction. This part is very similar to 1998. Prices did their thing by falling down and now slowly rebounding. OPEC is making the decision they are not the marginal barrel. Unlike their decision in 1997, they are likely right. Time is the key to how this all unfolds. The daily and weekly gyrations of crude oil prices are made by traders who believe they are able to read the dynamic tea leaves. The story of the oil markets can be explained by examining the details in the demand and supply fundamentals from the past and now.
Supply
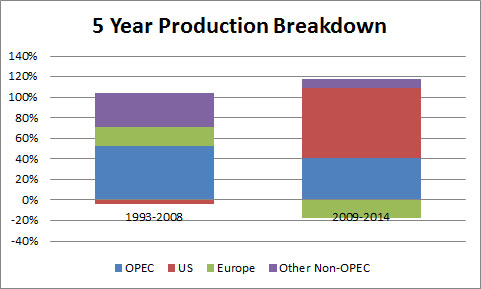
From 1993 to 1998, Non-OPEC production grew almost by 10% with OPEC growth in production nearly 20%. In addition, the Non-OPEC production outside US and Europe represented the majority of the Non-OPEC production increases. This is much different than 2009 to 2014 figures. Both OPEC and Non-OPEC production grew close to 8%. The majority of the Non-OPEC production growth came from the US. The dynamics of the increasing production will lead to a different result compared to 1998.
In 1998, most of the battle of production/market share was battle within the organization. The Non-OPEC production was coming from a diverse group with Europe production gains representing the largest group. Non-OPEC gains were coming from some significant finds which took a large capital cost to develop and was going to take many years to fully hit the production peaks. OPEC tried to hold the line, but they were only going to capitulate themselves. The Saudi’s showed the world a glimpse of producing oil near the kingdom marginal economics. This was too painful for many of the members and they succumbed to over producing their quotas which realigned the market over many years given the growing Non-OPEC production.
In 2014 most of the production gains is resulting in OPEC market share eroding in the largest oil demand market. This is no longer a battle within the organization. The marginal economics for this increasing production is much higher than in 1998. In addition, the profile of this production requires continual investments versus large capital outlays to maintain and increase production. This very fact will create a dynamic response to price which was missing in 1998. This is not a cure for a rebound in price over the next few weeks to months, but it will be a response which could not have occurred in 1998 without OPEC coordination.
Demand
The demand picture has some similarity between 1998 and now, but there are some distinct differences, just like in the supply picture. The similar aspect is the fact that the first sign of market weakness stemmed from the demand concerns in the Asian economy. The distinct difference is the development of the demand concern is much different.
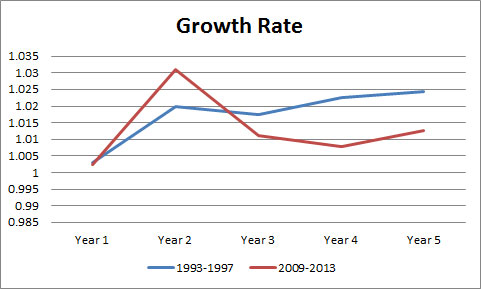
Going into 1998, world oil demand growth was averaging a 2% growth per year with Asian demand growing by over 5% a year. China was growing nearly 8% a year. Most pundits at the time were expecting continued growth in the region. The problem I identified early on is the massive growth year after year was leading to some very large absolute numbers. In examining historical growth of developing countries, it showed eventually a country demand growth slows down after 5 to 10 years of strong growth as infrastructure is needed to expand further. The Asian financial crisis created a dramatic shift in demand expectations. Oil producers were caught off guard as capital was spent in expectations of demand growth.
Going into 2014, world oil demand growth was only averaging 1.3% after the 2008 financial crisis. Asian demand was averaging 3.5%. World oil demand growth from 2011-2013 has averaged only 1% a year. European petroleum has been in a downward spiral since 2007. Unlike 1998, no one should be surprised with lackluster demand growth. Given the dismal demand numbers for the past few years, demand is likely to be more surprising than a production correction.
Putting it All Together
With slowing demand growth and increasing production, a price correction becomes inevitable. The price is now trying to find the price point to slow production and/or increase demand. Production is going to react faster than demand. OPEC made the right decision to let the prices come off. If they cut their production it would have created a dislocation in the supply curve and ultimately lead to a reduced revenue stream. In 1998, this strategy would not have worked given the production competition was largely within the group and with the Non-OPEC production coming from large capital projects. This time, we have a market with production coming from N. America which is dependent on continued capital investment to maintain production. We expect the market to find enough marginal wells in US and Canada around the $60-$80/bbl range to balance the market for the next few months. After that, I expect the market to recover as demand will naturally rebound given the 20-30% price decline. I think, by next year, we will see demand much stronger than the current IEA outlook.
Some have asked why I skip the 2008 price correction. The 2008 price change was more of a function of the global economic crisis, and I consider this an outlier in terms of fundamental supply/demand issue in the oil market. However, in the presentation, I do cover the 2008 peak price and the actual prediction I made in calculating the maximum peak of the oil prices – $145/bbl (prediction) vs. actual of $147/bbl.
As noted, in my other articles on the oil markets (Crude Oil Markets not 1998 & Crude Oil Collapse) I have a complete presentation that I can present to you and your team offering a unique perspective on the oil market. We take the time to truly understand the past so we can appropriately reflect on the future. Please do consider All Energy Consulting to offer your team insights on the oil markets. The presentation includes price forecasts and explanations including a discussion on refining margins.
Your Over 10,000 hours of Analyzing the Oil Markets Energy Analyst,
David
David K. Bellman
All Energy Consulting LLC- “Independent analysis and opinions without a bias.”
614-356-0484
[email protected]
@AECDKB
blog: https://allenergyconsulting.com/blog/category/market-insights/
Another 30% return in Month Time? – Next Trade De Jour
It will be hard to beat my BEST winter trade call for buying the Dec. 2014 AD-HUB minus NYJ spread – As of 11/24/14 close, the spread moved to -$31/MWh vs. when we wrote about it at -$44/MWh – up 30% since October 9th 2014. I hope all of you took my advice when you read about it.
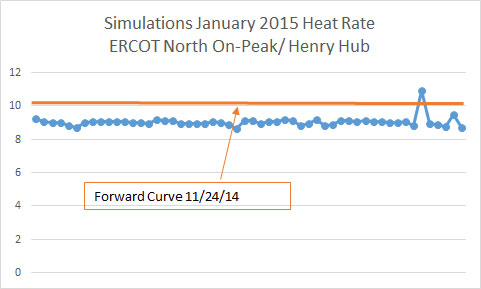
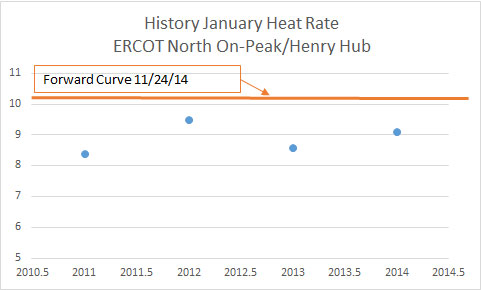
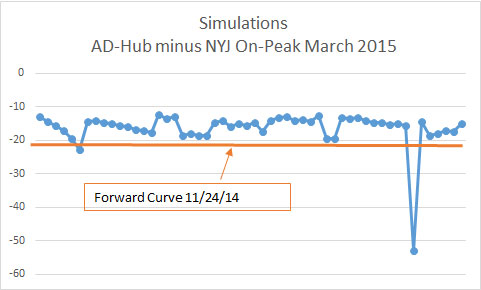
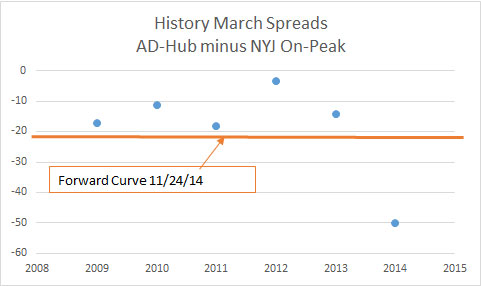
Likely my last and final timely free call to you (in this case the release was delayed only a few days -some received an early release of the analysis ahead of time) will be to sell the January Ercot North On-Peak Heat Rate (ERCOT North On-Peak / Henry Hub) and to once again take a look at buying the AD-HUB minus NYJ Spread this time in March 2015. As previously discussed, the process to identify these trades was to use the built in screeners from PMA-NT default runs. Then, a complete analysis was applied to stress test these trades, both from a future and historical perspective, as described in my previous article.
The ERCOT North Heat Rate sell is based on over 50 simulations plus a historical perspective. This is not going to be a huge money maker but the risk of loss is minimal. The current forward curve is showing a 10.11 mmbtu/ MW heat rate. In the last 4 years, the highest heat rate achieved was 9.54 in January 2012 and the lowest was 8.4 January 2011. Based on over 50+ simulations, the average heat rate was 9 with only 1 simulation greater than 10 at 10.5. I feel very comfortable with this trade.
The AD-Hub minus NYJ On-peak spread has treated us very well this winter. Examining the March 2015 spread, we see the same opportunities. Currently, the spread is trading at -$23/MWh. Unlike our past call, there is more risk in this trade. There is 1 simulation – the weather profile of 2013-2014 – which produces a -$52/MWh trade. This compares with the historical actuals of 2014 March of -$51/MWh (Nice Calibration!). Outside last year, from 2009-2013, the March spread has averaged -$13/MWh. The 50+ simulations produced an average of -$16/MWh (which includes the one simulation that was more negative than $25/MWh). This is a great trade if you feel comfortable with the weather risk. In our slew of simulations we did run the weather for the past 12 years with only 1 year indicating a loss for this trade.
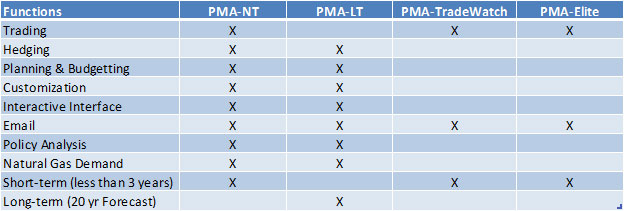
I will release a new publication product – PMA-TradeWatch. PMA-TradeWatch will screen out trades based on the default setup of PMA with a layer of historical screening. These trades will represent the first layer (identification) of trades to look into. A file will be sent daily to subscribers. As I noted in my process in finding the BEST winter trade, it takes more work than the initial screen to really prove this to be a trade to place your money on. PMA-TradeWatch is a report to indicate to you potential trades. With this list it will narrow the amount of investigation. Ultimately I would recommend running more simulations and applying more historical analysis. Following this process will lead to successful trades similar to my best winter trade. We could facilitate the process for additional simulation and analysis for an additional fee. However, at some point, it would be more cost effective to do PMA-NT.
We may release another product PMA-Elite which goes above and beyond PMA-TradeWatch and goes through the process and does the work to give these winning trades. PMA-TradeWatch is an ideal augmentation for those who already are staffed with a full team of analyst. They can shoot holes and discover the winning trades from the list supplied by PMA-TradeWatch. PMA-Elite is designed for traders needing the complete analytical solution to finding money making power trades. Both PMA-TradeWatch and PMA-Elite are focused on trading. Our other products are designed for greater breadth of usage – see below table for summary.
We hope that all our articles have proven the success and efficacy of our Power Market Analysis platform (Summer Trading, Summer Hedging, Winter Trading). Please do consider All Energy Consulting for your analytical needs in the power spectrum. All fuels ultimately lead to power. Building up the energy foundation from power makes sure all things are tied together.
I hope you had a wonderful Thanksgiving. Thank you so much for all of your support.
Your VERY Thankful Need to Exercise Energy Consultant,
David
David K. Bellman
All Energy Consulting LLC- “Independent analysis and opinions without a bias.”
614-356-0484
[email protected]
@AECDKB
blog: https://allenergyconsulting.com/blog/category/market-insights/
Ethane Favored Status – another convergence to power
I have had many responses to my previous article Splitting the Profit – Condensate Splitter Under Pressure. Let me clarify some of my points and highlight some valid feedback.
US ethylene production is mainly from ethane, whereas the rest of the world is Naphtha. However, the point I was trying to extend is the rest of the world may very well also move to more ethane, as I believe ethane exports are viable via ships that carry ethylene – see below. This puts more pressure on Naphtha pricing as the rest of the world can eventually shift to ethane if Naphtha pricing is not in balance with ethane. In addition, given the expansion of ethane crackers in the US, this may very well put pressure on ethylene cracking margins which then translates to feedstock such as Naphtha.
In summary, my main concern being expressed in the original article are those investing in condensate splitters, in hopes of mitigating the condensate discount, may just be shifting their concerns to Naphtha discounts. As noted previously I believe there is room for condensate refineries. I have been working on one that just needs funding. As with many things, in order to make money you need money. This is a refurbishment for an existing condensate refinery with a cost range between $400-600 million. I can supply more information just send me an email [email protected].
I certainly was not trying to completely solve the ethane issues in the previous article. There is no doubt ethane problems are real and will be very challenging, particularly the next few years as many projects are still in permitting phase. Based on the available information, I believe exporting ethane is the way to balance the market in the meantime. As noted above, one could use ethylene carriers to transport ethane. Ethane can potentially be the “bridge” fuel for locations requiring power, but without the required scale of LNG. There are several engine manufacturers working to be able to use higher and higher content of ethane. Ethane use for power generation can easily be converted to LNG when the required scale is reached. In the meantime, regions burning oil (many outside US) can look to this economical and viable alternative to oil. With ethane flexibility to be used in petrochemical and power generation, ethane may actually end up being a favorite child from a step child as I alluded to in the first article.
All fuels ultimately lead to power. Building up the energy foundation from power makes sure all things are tied together. Many consulting companies are driven from the Oil & Gas side of the analysis as more revenue comes from those industries, but at All Energy Consulting we are driven through intellectual integrity. We report to no shareholders and have no targeted mandates.
We wish you a Happy and Safe Thanksgiving. Thank you so much for all of your support.
Your VERY Thankful Full Spectrum Energy Consultant,
David
David K. Bellman
All Energy Consulting LLC- “Independent analysis and opinions without a bias.”
614-356-0484
[email protected]
@AECDKB
blog: https://allenergyconsulting.com/blog/category/market-insights/
Sign Up to AEC Free Energy Market Insights Newsletter
“Pull a thread here and you’ll find it’s attached to the rest of the world.”
Nadeem Aslam, The Wasted Vigil
Splitting the Profit – Condensate Splitters Under Pressure
As I noted in the Condensate Economics Explained this summer, condensate splitters will not be a sustainable solution to the condensate flood in the US by itself. The recent article by RBN indirectly supports this claim. RBN expects very high natural gas liquids (NGL) production. The problem child in NGL is ethane. Ethane, because of its unique property relative to propane, butane, and pentanes plus, requires much more effort to liquefy. Therefore, often ethane is left in the gas stream (rejected) versus extracting and supplying it to the petchem industry. However, only so much ethane can be left in the dry gas stream before it would fail to meet pipeline specifications.
With ethane falling to the lowest level ratio in decades to natural gas, there is a large incentive to go ahead and leave as much as one can in the dry gas stream. As also noted by RBN, there is just so much NGL that ethane will easily exceed the current demand levels leaving prices to likely free fall in certain regions. This will result in petchem plant demand which brings us back to Condensate splitters. The yield of condensate splitters is mainly Naphtha. Naphtha is used by many petchem plants. There exist many chemical plants which can take multiple feedstocks to produce the same product. The driving products of the petchem industry are known as Olefins (CnH2n) – a hydrocarbon with one double bond carbon and single bonds elsewhere – aka Alkenes (sorry about being so nerdy, but sometimes you just have to be technical to really understand it all – I also need to use my Chemical Engineering Degree every now and then). These Olefins include the more recognized names of ethylene, propylene, and butylene. The process of taking the feedstock and converting the product is typically called cracking. The reason for this is because you are breaking the molecular bonds and producing a new combination which constitutes your product.
Historically speaking Naphtha is the dominant feedstock for world production of olefins. For ethylene production Naphtha represents almost 50% of the primary feedstock. However the use of ethane to make ethylene is rapidly growing. Hopefully by now you are starting to see the convergence of Condensate Splitter and Ethane. Even if a petchem plant is designed for a certain feedstock – all it takes is some capital to be able to process other feedstock. Those who built US condensate splitter hopefully did their economics based on significant market competition with ethane.
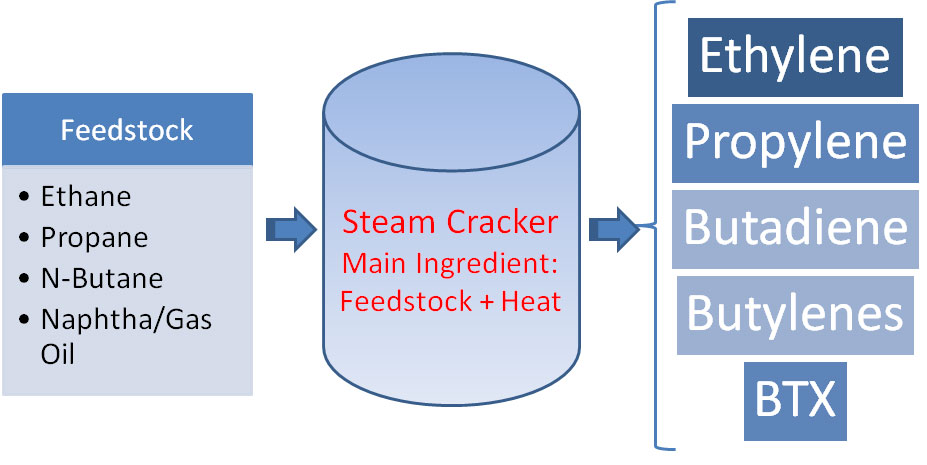
Petchem plants are essentially a simplified refinery. Compared to trying to model refineries, petchem modeling is much simpler. The feedstock is typically already cleaned out and the process can be placed in one block versus multiple conversion equipment in refining – see Figure below.
Cracking a certain feedstock will result in varying yields of product – similar to processing crude oil in refineries. There is a value point where one feedstock will be more profitable than another. A complete gross margin can be computed for the varying types of crackers. Gross Margin at a Petchem plant = Product Prices x Yields – Variable Cost – Cash Cost – Fixed Cost. Similar to a refinery each of these components will be different depending on your feedstock.
Potentially All Energy Consulting will release another product Chemical Market Analysis (CMA) where, on a daily basis, a computed value of the various cracking modes (ethane, propane, butane, natural gasoline, and Naphtha) is computed based on future markets. We are close on our Oil Market Analysis (OMA) product release. Both these platforms will enable the user to input their own future expectations of price and a computed value will be calculated. We have the models and the platform and are just looking to finalize our data provider. Please email me if you are interested in either of these products. If you have your own forecast data, we can deliver this to you right now.
Your Split in Many Ways Energy Analyst,
David
David K. Bellman
All Energy Consulting LLC- “Independent analysis and opinions without a bias.”
614-356-0484
[email protected]
@AECDKB
blog: https://allenergyconsulting.com/blog/category/market-insights/
Sign Up to AEC Free Energy Market Insights Newsletter
“Pull a thread here and you’ll find it’s attached to the rest of the world.”
? Nadeem Aslam, The Wasted Vigil


