Most Energy Efficient State – Apples and Oranges
![]()
The American Council for an Energy-Efficient Economy (ACEEE) produces a list of the most energy efficient state each year – link to the report. This report was blasted across the news – Forbes, US News, Bloomberg etc… There was no doubt made by the reporters that the report was empirical and 100% accurate. However, energy efficiency is not an absolute number and requires some thought to produce given the uses of energy and the environment. There are many issues with energy efficiency rankings and how one deciphers the ranking. We will show you a perspective that makes one of the highest ranked energy efficient state in ACEEE rankings to be not that energy efficient after all.
The simple definition for energy efficiency is using less energy to provide the same service. In the end, energy efficiency like energy is only a means to an end, not the end in itself. Without a thorough understanding of that fact, this can lead to misleading conclusions. There are many opportunities in energy efficiency analysis that can lead to apples and oranges comparisons causing poor policy choices.
If one state is mild in weather and yet produces widgets with less energy – this does not mean they are more energy efficient via their programs or technology, but perhaps they are more efficient because of location. Therefore, to deduce that programs and technology from one state should apply to another state without weather normalization is misleading. For those not aware of this fact – the majority use of energy when it comes to weather in the US is for heating. There are more Heating Degree Days than Cooling Degree Days – see figure below. Trying to compare states without being aware and accounting for weather difference can lead to poor policy choices. (Will global warming reduce energy consumption for climate control in the US? See figure below)

Energy efficiency has also been expressed as energy intensity – a measurement with economic parameter typically Gross Domestic Product or Gross Domestic Product per capita. Therefore, the outcome expresses the use of energy and the conversion to the economic parameters – Energy/Dollar. The figure below displays Retail Sales MWH / GDP on a state by state basis. California and the East Coast states look superior to others.

If state A economy depends on industrial manufacturing to make the widgets used by state B whose economy involved services such as finance to telecom, the energy intensity calculation would infer that state B is superior to state A. However, this is not the case in reality. Using more energy to generate the equivalent GDP does not mean state A is inefficient. State A should not be made to confirm to state B energy standards for the sole purpose of energy efficiency. An energy efficiency comparison can be made to state C whose economy is very similar and makes the same amount of widgets. States with different economies cannot be compared in terms of energy efficiency. One could argue the merits of the economy choice (production vs. service economy), but one cannot take the energy efficiency as being comparable given the end product is completely different.
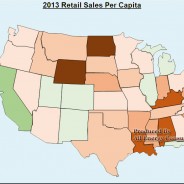
The amount of people in a state is also a key point to address. The shear population density changes the use of energy. Those living in close quarters will generally use less energy as the housing is likely smaller and the ambient energy use from your neighbor can reduce your energy use. To take a more dense population region and try to extrapolate the energy efficiency programs and goals to a region not as dense is comparing apples to oranges. By doing, so you are requiring a change beyond energy use if you plan to produce similar results. The figure below presents the Retail Sales Per Capita by state. Once again California and the East Coast states look superior to others. However, we know they have a much higher population density per square foot than the rest of the country.

What people are doing in each state is also important in analyzing energy usage as it relates to the economy. If you have a region where significant portion of the population are not employed (a result of unemployed adult and more children in one state than another) their energy usage will be much less than those whose population is working. The employed force potentially creates a more balanced metric of economic parameter than GDP and population given the credit for job creation. In addition, those people are the ones paying for energy whether at home or in the workplace. The figure below shows the percentage of employed workforce by state. The surprise is California. California no doubt will be more youthful, but the temperate weather probably leads to heighten level of a casual beach life. There is not much energy usage sleeping on or near the beach. Policy makers would not want to produce policy that lead to great efficiency only to lose jobs.

If we view the metric that normalizes weather by dividing energy use by degree day plus incorporate the amount of people employed we can produce a metric less on locational luck and more focused on energy usage and underlying economy – jobs. The figure below does just that.

The ACEE report perspective is similar with this perspective for the NE states. Those states, as noted in ACEEE, use their energy well given the weather conditions. However, the number 2 state in their ranking, California, seems to be very lucky given their sunny and temperate disposition based on this perspective. Ohio, in this measure, actually ranks better than California. This perspective still does not account for the less density living found in Ohio relative to California, so in that light, Ohio is doing quite well.
Many in the state of Ohio are enamored about all the great efficiency reports being claimed from California. They are desperate to follow California down their path – we just hope they separate the apples and oranges. To even approach some of the metrics presented from California, Ohio will need to change its culture and temperature – both improbable task. All Energy Consulting is not advocating this is the one correct view – we are being observant and open-minded when it comes to variables such as energy efficiency. There are many lenses to look through to fully appreciate the various energy issues.
If you enjoy this type of analysis, please do consider supporting All Energy Consulting by contacting us for your energy consulting needs. We are able to offer these types of analysis because of the support we get from our clients. All Energy Consulting offers a pragmatic but enlightening approach to analyzing the energy markets. Our focus will always be for your success.
Your Looking Through Multiple Lenses Energy Analyst,
David
David K. Bellman
Founder/Principal
All Energy Consulting LLC- “Adding insights to the energy markets for your success.”
614-356-0484
[email protected]
@AECDKB
