10 Year Weather Analysis Show 2010 Most Volatile Year
Weather has been one of the largest variable for power, coal, and gas markets. In the latest study available to PMA subscribers, each of the last 10 years of weather was put into our load and power model to deliver a concise view of the impact of weather.
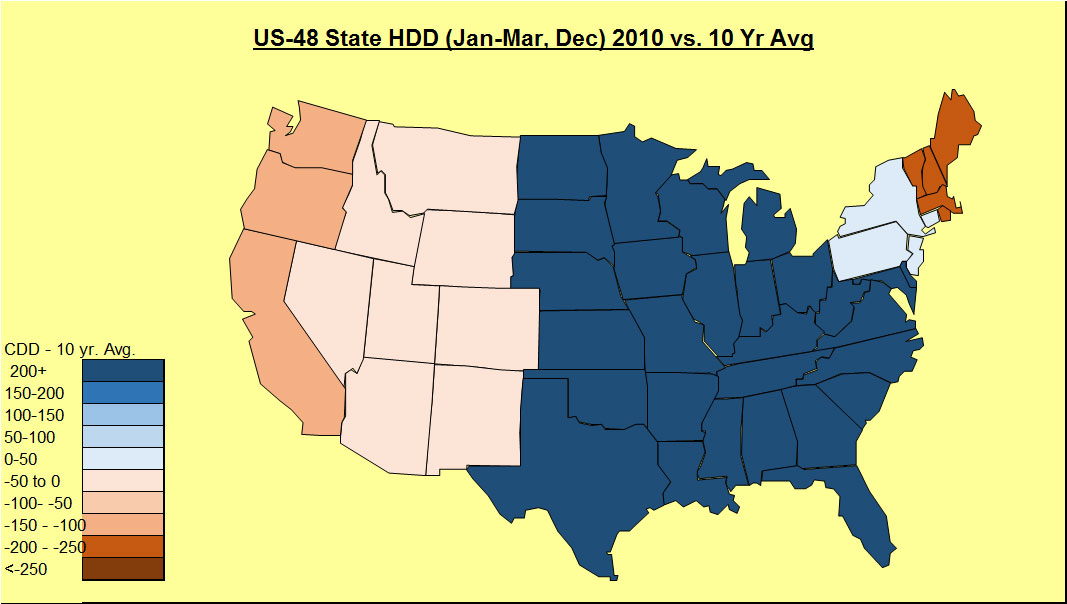
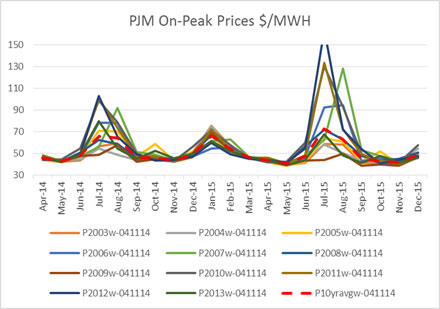
The study individually graphed the variation of weather for both summer and winter impact. The most volatile year happened to be 2010.
2010 Winter
2010 Summer
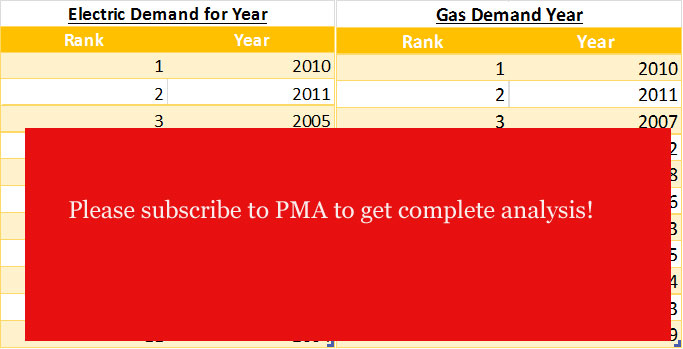
In addition, each year was ranked according to the electric and gas demand. The electric and gas demand do not necessarily align as different regions have various portfolio of generation options.
Total Year Ranking
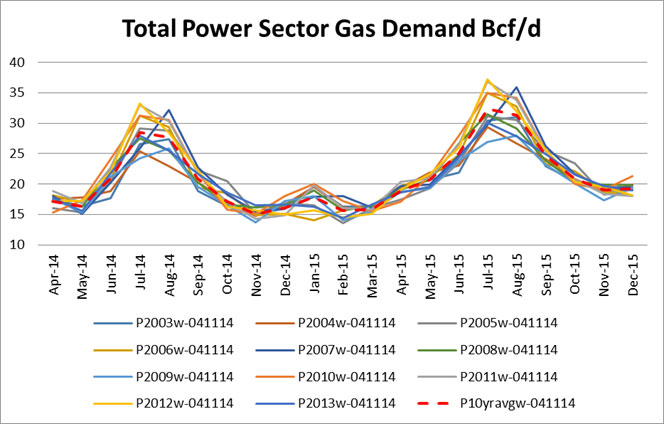
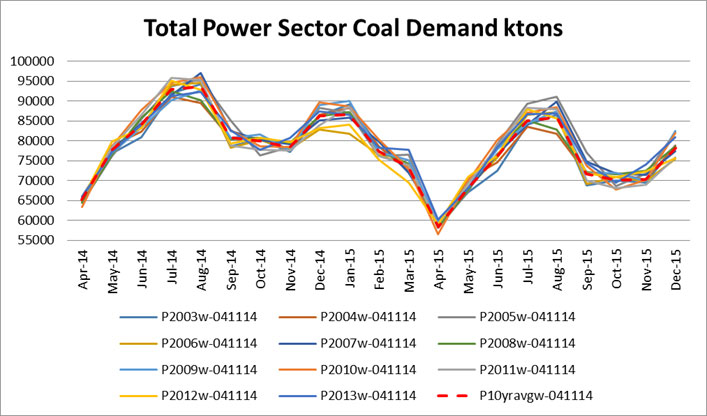
Fuel burns and power prices are also presented in the study.
Gas Demand
Coal Demand
PJM On-Peak Prices
PMA subscribers get full access to the data files. Both on and off peak prices are in the data file plus over 15 regions across the country. Demand can also be broken up by state or even coal basin. This analysis allows weather to be quantified for gas demand, coal demand, and power prices. In addition any asset or portfolio can be extracted from the data to learn how sensitive these assets are to weather.
PMA subscribers get the online access, the daily files, and the study files. In addition, prime members receive-at no additional cost reports such as presented above, the Summer 2014 Outlook report , the recent briefing on what is causing the gas demand drop, and where it is coming from. Subscribers also have the opportunity for free private consultations. Discussions can range from answering more detailed questions on the studies to discussing potential scenarios of the future.
Our latest update to our daily file is designed for power traders and risk teams. The interface allows one to quickly see the current power forward curve along with the models view on the market. There is also an additional line which adjust the models results based on historical tendencies in the model.
A demo of the daily file is available with restricted viewing. Click here to download.
Please contact me to schedule an online demo meeting [email protected] or 614-356-0484
Your Inspired Energy Consultant,
David
Founder & Principal
All Energy Consulting LLC
“Independent analysis and opinions without a bias.”
614-356-0484
[email protected]
blog: https://allenergyconsulting.com/blog/category/market-insights/
Normal Weather vs. 10 year Average – Significant impact to Gas and Power Markets
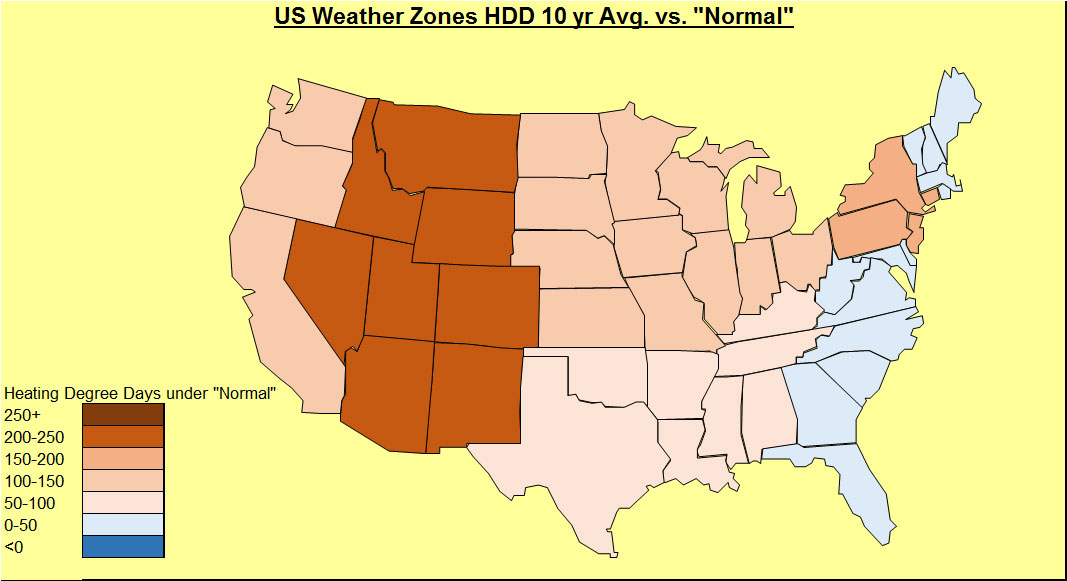
We are investigating “normal” weather. Our normal weather came from NOAA. According to NOAA, “Climate Normals are the latest three-decade averages of climatological variables including temperature and precipitation. This product is produced once every 10 years. The 1981–2010 U.S. Climate Normals dataset is the latest release of NCDC’s Climate Normals.” In the last 10 years, not many places have been close to normal. The trend in both HDD and CDD shows to be warmer over the last 10 years as compared to normal. More CDD and less HDD are observed when comparing to normals.
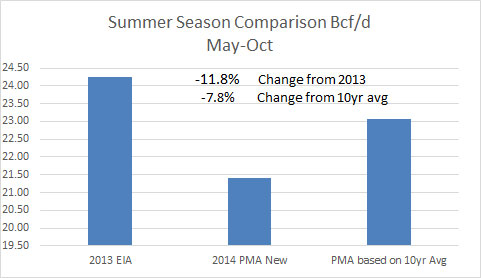
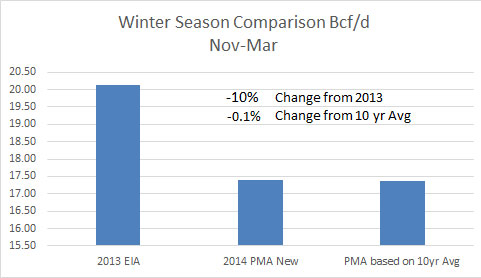
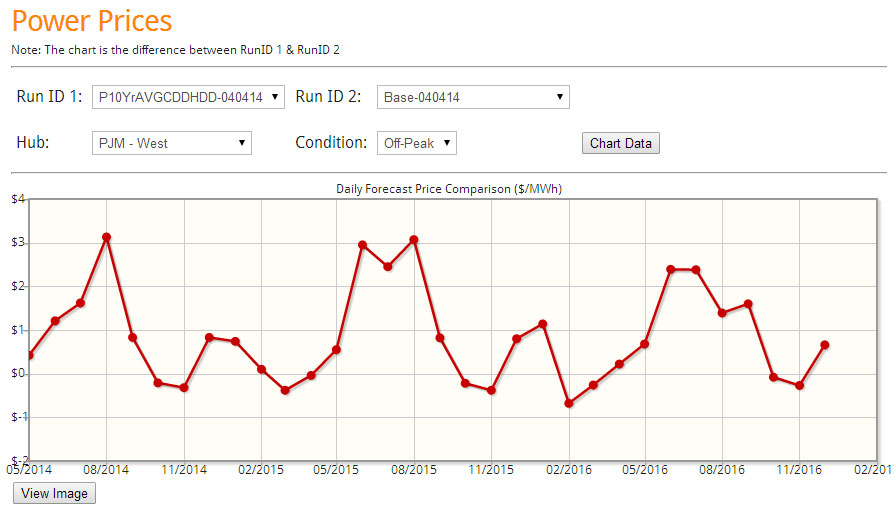
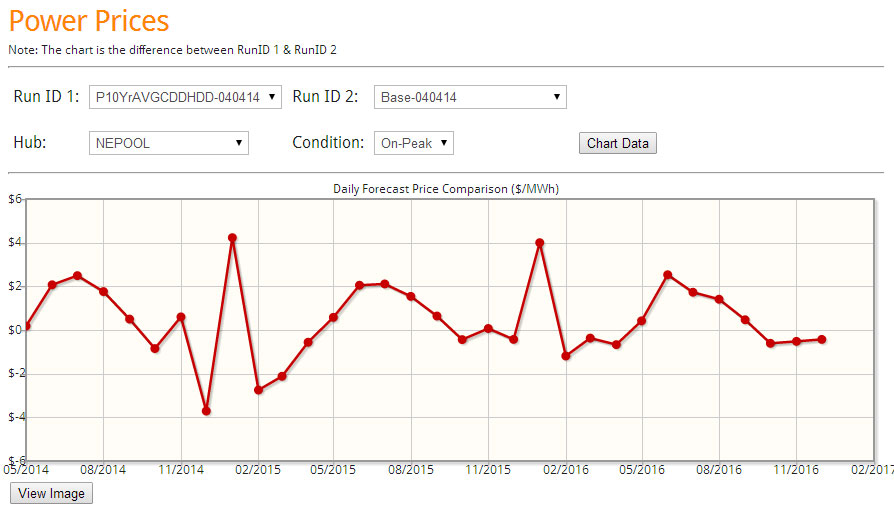
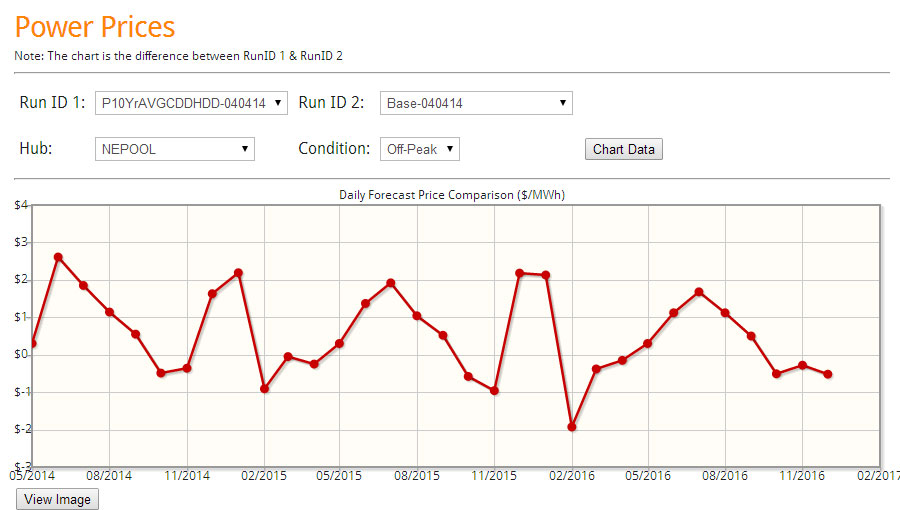
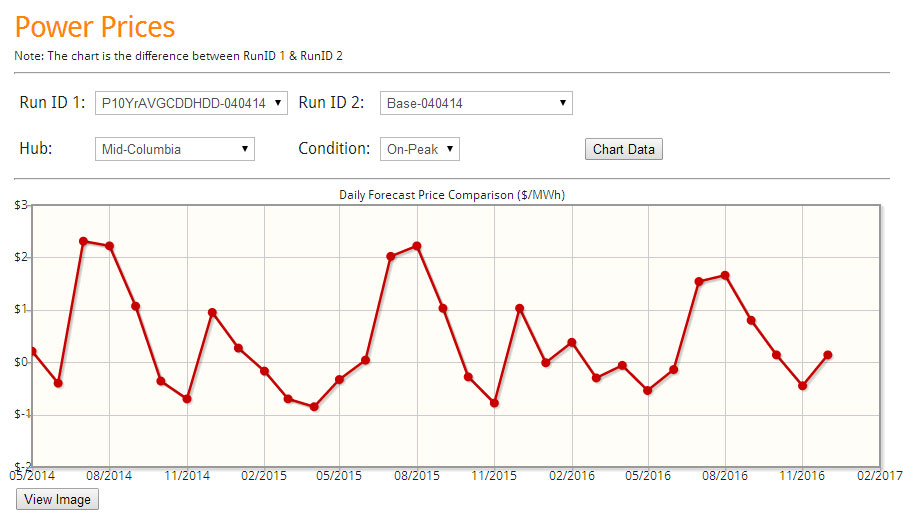
The 10 year average is clearly warmer than the NOAA normals. The impact on our base case in our Power Market Analysis (PMA) product shows a significant impact on the power markets. This translated to natural gas demand in the power sector rising 8% compared to the base case for this summer. Winter is essentially the same.
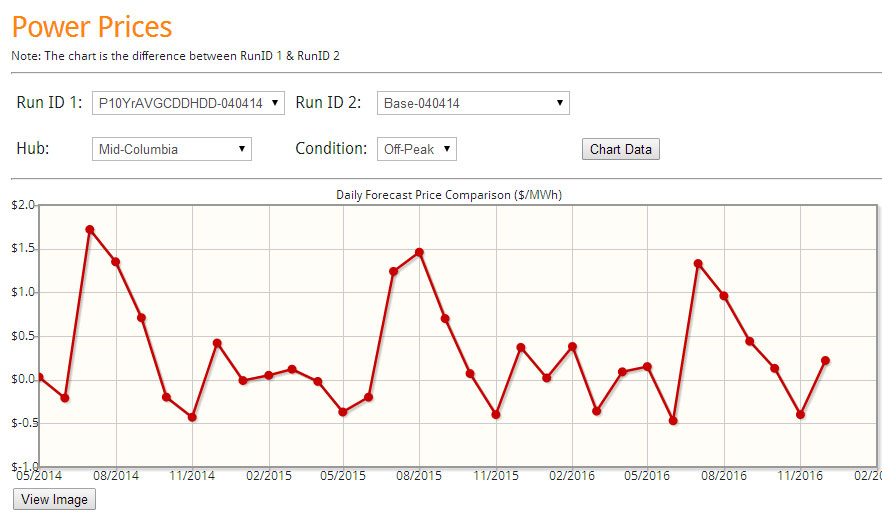
Power prices are significantly impacted by the weather change in certain regions. The below figures are screenshots which come from our online interface for our Power Market Analysis (PMA) subscribers. Each day the model dispatches the entire N. America based on the latest future markets price for coal and gas. Daily files are produced each morning similar to the above graphs. Plus the online interface allows users to quickly compare various runs. In this case, we are comparing the 10 year average weather vs. the Normal weather supplied by NOAA.
Many more regions are available to compare. In addition to power prices, there are comparison available for coal and gas consumption and input price comparison. Easy drop downs allow one to see how the future markets have impacted the power markets. PMA subscribers get access to the files including a complete analysis of 2015 and 2016 comparing the NOAA normals vs. 10 year average.
Soon, PMA subscribers will get a complete analysis of the last 10 year weather. Each year will be individually analyzed allowing subscribers to be able to choose analog years to represent the forecast.
PMA subscribers get the online access, the daily files, and the study files. In addition, prime members receive-at no additional cost-reports such as the Summer 2014 Outlook report , the recent briefing on what is causing the gas demand drop, and where it is coming from. Subscribers also have the opportunity for free private consultations. Discussions can range from answering more detailed questions on the studies to discussing potential scenarios of the future.
Please contact me to schedule an online demo meeting[email protected] or 614-356-0484
Your Inspired Energy Consultant,
David
David K. Bellman
Founder & Principal
All Energy Consulting LLC
“Independent analysis and opinions without a bias.”
614-356-0484
[email protected]
blog: https://allenergyconsulting.com/blog/category/market-insights/
Last two days gas futures down by 5% – What impact is that?
Everyday the model results of the latest market changes are awaiting for you. The majority of the time, the market doesn’t moved dramatically enough for you to care, but when it does Power Market Analysis (PMA)is there for you.
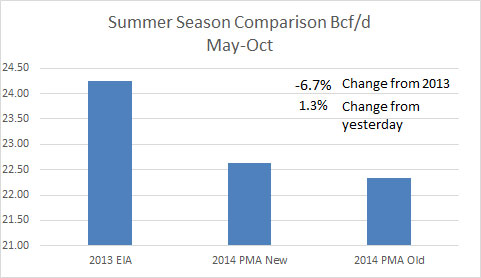
April 1st, 2014’s daily file shows the changing commodity prices resulted in an increase of 1.3% for natural gas demand for this summer relative to the March 31st file. The figure below comes from the daily file.
Our online interface allows you to compare daily runs on the fly. The below graph comes straight from the online interface and it shows the change in gas demand from April 1st, 2014 to March 28th, 2013 run. The above compared the April 1st, 2014 run to the March 31st, 2014 run. Summing up the below chart change for this summer, the last two days have changed the expected summer gas demand by more than 4%. (~0.9 Bcf/d.) Click graph to get enlarged version.
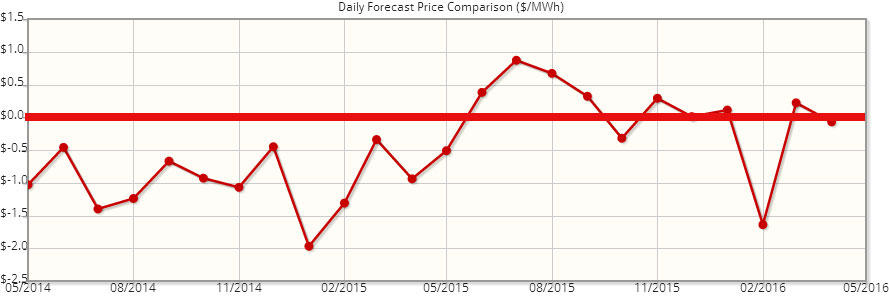
You can also compare future prices over time to get a sense of how the future’s market has changed over time. The below graph compares the Henry future curves of April 1st, 2014 versus February 28th, 2014. The red line is the zero line. Click graph to get enlarged version.
The market is valuing more future winter risk relative to the end of February. However, the rest of the time the market is lower than it was just a month ago. The prompt year is down by around $0.30/mmbtu.
The online interface offers a simple drop down to compare different gas basis. Dominion South Point continues to get more negative in April relative to February futures. Click graph to get enlarged version.
The online interface also allows comparisons of power prices across the country. The below show the impact of the last two days gas price drop on PJM-West On-Peak prices.
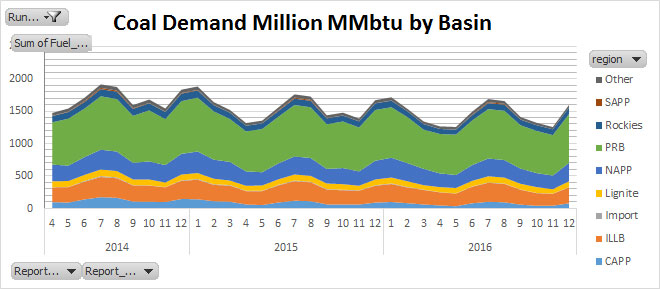
Coal burns by basin are now available. As coal units install control equipment, will we see a reduction in PRB? What type of coal will be hurt the most as coal units retire? These answers are available to PMA subscribers.
PMA subscribers get the online access, the daily files, and the study files. In addition, prime members receive-at no additional cost-reports such as the Summer 2014 Outlook report , the recent briefing on what is causing the gas demand drop, and where it is coming from. Subscribers also have the opportunity for free private consultations. Discussions can range from answering more detailed questions on the studies to discussing potential scenarios of the future.
Please contact me to schedule an online demo meeting [email protected] or 614-356-0484
Your Inspired Energy Consultant,
David
David K. Bellman
Founder & Principal
All Energy Consulting LLC
“Independent analysis and opinions without a bias.”
614-356-0484
[email protected]
blog: https://allenergyconsulting.com/blog/category/market-insights/


