Winter Power Fuels Consumption Sensitivities (Gas & Coal)

As noted in my previous write up, we could see a record amount of natural gas demand in the power sector if certain stars align. One of the major drivers is the price of natural gas. The two price components for natural gas is the benchmark location of Henry Hub price and the basis (price differential to Henry Hub). In this Winter Power Outlook report, we ran over 50 cases. Our gas price sensitivities included changing Henry Hub (28 sensitivities) and then just changing basis prices (10 sensitivities). The below figure is a redacted output from the report.

For this winter, the correlation with Henry Hub price and power natural gas demand is very linear. With the purchase of this report for only $3000, you will get the data and the associated linear equation. This will give you grounds to estimate the power markets natural gas demand as a function of your expectations of Henry Hub.
Changing the price of Henry Hub also altered the coal demand. The redacted figure below shows the relationship of coal demand and Henry Hub. As in the natural gas demand figure, the coal demand outlook is very linear with the changing Henry Hub price.

Changing basis by a set percentage from 50% to 150% did not significantly alter the gas demand. The basis impact altered gas demand by +/-2%. However, power prices did significantly change. In the Nepool region, the basis sensitivities produced nearly a +/-30% swing in on-peak power prices – see below figure. The winter report will contain price output for all major power hubs in N. America with the associated simulations.

A common mechanism used in the industry to estimate natural gas demand is the usage of a relationship with Heating Degree Day (HDD). However, in the power sector, that relationship is very fragile as location and price relationships can cause a non-linear relationship. The figure below demonstrates this with simulations of each weather year between 2003 and 2013.

For only $3000, our Winter Power Outlook report will have enough information for you so there will be no guessing to what the power markets will do for gas and coal consumption under various scenarios, whether it be price, weather, or unit performance. The first 5 subscribers will also be able to create their own custom outlook run. You can select and combine various weather years, change henry, and/or change basis price. We will run your custom case and give you all the output from that case. In addition, to the report you will get access to PMA-NT for one month. PMA-NT updates daily, therefore you will always have an updated third-party view of the near term market (2-3 years). PMA-NT can be used for hedging or trading as demonstrated in our previous articles – Effective Power Hedging and Excellent Returns.
A new product is coming. PMA-LT will be released soon. PMA LT is a monthly forecast out to 2035 produced quarterly. Given the long-term outlook, a fundamental gas view point was developed in coordination with RBAC the makers of the GPCM® Natural Gas Market Model. The quarterly outlook will present monthly prices for all major N. American power hubs. In addition, a report will be included to support the outlook. Description of retirement and expected new builds will be detailed in the report. PMA LT subscribers can get access to gas pricing and a report supporting the gas fundamental outlook. Customization of long-term outlook (e.g. Carbon policy) is also available to subscribers.
Please call or email to sign up for the Winter Power Outlook Report or PMA-NT or PMA-LT [email protected] or 614-356-0484.
Your Grateful Energy Consultant,
David
David K. Bellman
All Energy Consulting LLC- “Independent analysis and opinions without a bias.”
614-356-0484
[email protected]
@AECDKB
blog: https://allenergyconsulting.com/blog/category/market-insights/
Sign Up to AEC Free Energy Market Insights Newsletter
Winter Power Price Outlook – Not as Bullish as Last Year

The forward curve is shaped to expect last year’s historic cold winter – see graph below. However last year was very atypical and back to back winter extremes are not common. The power prices being extreme multiple years in a row are nearly impossible to find. This is because generators take action based on last year’s results more often than relying on statistical or analytical process to account for potential variations.

The largest issue in 2013-2014 winter was not directly the result of weather, but 2012 and 2013 market conditions. Due to poor market conditions in 2013, many coal plants before winter did not prepare for winter as they typically would do. Many plants were likely not allocated their standard fixed cost budget to prepare for winter given such poor market conditions for plants in 2012 and 2013. As a result 70% of the forced outages were not from increased gas demand due to weather as some may think, but from plants not prepared for so much demand and the colder than normal operation requirements. This does show the importance of maintaining and operating base load units. Without base load units,we can expect to have price run-ups much more frequently resulting in historically high wholesale power prices. Given this behavior pattern of generators, I strongly anticipate outages this winter to be very close to the average forced outage levels if not the best in years regardless of winter conditions. This will limit the price rise.
We have almost finished our winter outlook report using our advance product line Power Market Analysis Near Term (PMA-NT) (Click to Get Presentation on PMA-NT). For this winter analysis, we ran over 50 permutations simulating all the various conditions. These cases included changing henry hub in 10 cents increments from $3.5/mmbtu to $6/mmbtu to understand how natural gas price can change power prices. We also ran a range of natural gas basis price changes to better understand the natural gas price impact. For a better understanding of weather impacts to power price, we ran each weather year from 2003 to 2014 – including the 2013-2014 winter. In addition, we ran our standard high and low power prices which take a combination of the 50 permutations to produce a realistic high and low case.
A sneak preview of the analysis below shows the concern I have with the forward curve being bias to last year. If you look at the historic data for PJM-West, the former highest winter monthly power price was in December of 2005 at $101/MWh. The graph shows all the permutations we have produced. Based on the forward curve, if I wanted to be bullish this winter I would be more interested in the December than January contract.

All this analysis is available to you for only $3000 in our Winter Power Outlook Report. We will also supply a free 1 month access to PMA-NT (Click to Get Presentation on PMA-NT). Plus if you are the first five customers for this offer you can get a custom scenario based on the permutations already used. You can create your very own extreme case (e.g. Basis up 30%, 2013-2014 Weather, Plus Henry at $5.5/mmbtu, double forced outage rates). There is no other place to get so much information for so little. The report will be even larger and more comprehensive than the Summer Outlook we produced this year. If you take the time to review and understand the report, you will be fully prepared to understand the risk and key variables driving the power markets this winter. Call 614-356-0484 or email [email protected] to get this limited offer.
Your Energy Consultant,
David
David K. Bellman
All Energy Consulting LLC- “Independent analysis and opinions without a bias.”
614-356-0484
[email protected]
@AECDKB
blog: https://allenergyconsulting.com/blog/category/market-insights/
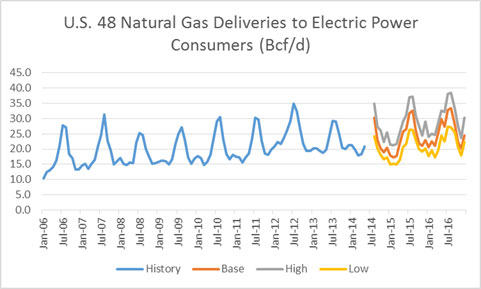
2014-2015 Winter Natural Gas Demand Expectations

Given the current forward markets and expected shift in generation resources this winter, natural gas demand in the power sector will likely come back down from the highs generated last year given 10 year average winter. However in our high gas demand case where weather is colder than normal and gas-coal spreads move in by 50 cents we can see record winter power gas consumption of 22.5 bcf/d (Dec-Mar) – see figure below.
Figure from Downloadable Excel File for Subscribers of Power Market Analysis (PMA)
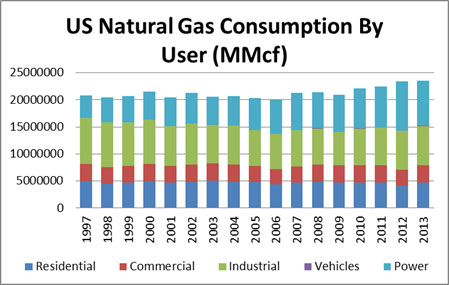
The new revolutionary product by All Energy Consulting’s (AEC), Power Market Analysis (PMA), is also designed to help those better understand the natural gas demand picture (Click for example of Power Trading and Hedging). Natural gas delivered to the ultimate end customer is made out of the following categories: Residential, Commercial, Industrial, Vehicles, and Power. The figure below displays the breakout by category by volume over time.
In a short time, gas usage has changed quite drastically with Power now being the largest demand portion for natural gas – see figure below.
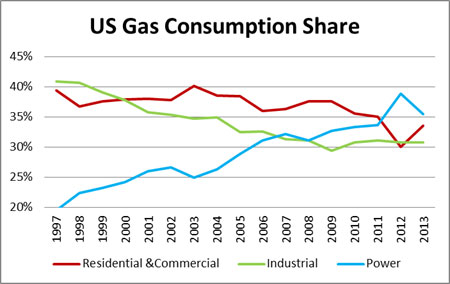
Unlike residential & commercial markets, the ability to forecast industrial and power gas demands go beyond the simple understanding of weather and the economy. The industrial picture is a data mining process of keeping track of plant closing and starts. The power demand is much more complex as there are significant inter-dependencies in the power market space. Gas demand in power is not just about price if that was the case demand would not have gone up over 4% a year from 2002 to 2008 while gas prices rose 15% a year. The reason for this rise had to do with required balancing of the market and the past market decisions – more discussed in our long-term gas outlook. The power market has a policy fundamental piece which causes certain technology to be retired (e.g. coal) and others to be built (e.g. renewable). In addition, the competing fuel price can cause significant demand swings (coal-gas switching).
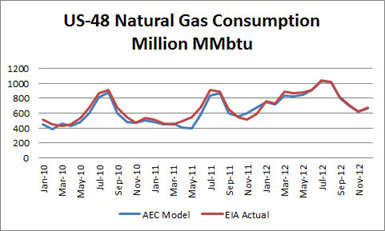
PMA is going to take the guess-work out for you in understanding the potential gas demand in the power sector. Our model is based on 20+ years of industry experience and took thousands of man-hours and hundreds of runs to develop and perfect. The underlying dispatch model used in PMA is AuroraXMP by EPIS. We can help those looking to implement AuroraXMP. The following results are historical runs with the actual loads and actual natural gas and coal prices depicted in the model. All other nuances, from outage and bidding logic, are the same as presented in the current PMA forecast models. The deviation from 2010-2012 averaged less than 4%.
Gas Consumption Power Sector Validation:
PMA will produce 5 cases of 2 year monthly projections incorporating all the risk in gas demand in the power sector from weather, economy, policy, and inter-fuel dynamics (coal-gas switching). Our model will run daily, incorporating the latest viewpoints from the forward gas and coal markets. The base model will also use AEC’s proprietary load forecasting model to project normal weather conditions. There are two gas sensitivities that will be generated along with the base case – high gas and low gas demand cases. The high gas demand uses historical weather on a monthly basis that drives the highest gas demand, plus it reduces the Henry Hub forwards will by 50 cents per MMbtu. The low case is the inverse of the high case with Henry hub forward adding 50 cents. These three cases will give you a good perspective on the high and low expectations of natural gas demand in the power sector. In addition, these cases can be customized to present even a broader range by incorporating nuclear outages to hydro capabilities.
PMA’s output is daily. Online visual displays are available. In addition, the gas consumptions are presented by month by state in an excel file which is in similar design to that published by the EIA. This format can be feed into leading natural gas analytical models such as GCPM by RBAC.
Texas Natural Gas Demand for Electric Power Excel Based View
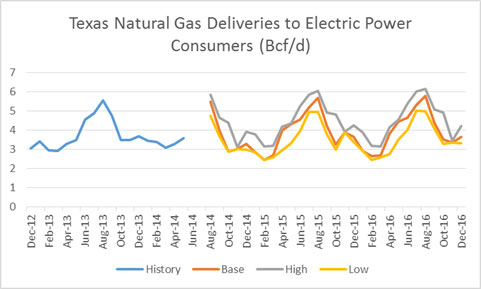
Please email me at [email protected] or call me (614-356-0484) if you’re interested in learning more about our new PMA service or would like to discuss a consulting project. Interested parties will receive a free sample output file along with documentation supporting the validation of our modeling efforts.
Your Energy Consultant,
David
David K. Bellman
All Energy Consulting LLC- “Independent analysis and opinions without a bias.”
614-356-0484
[email protected]
@AECDKB
blog: https://allenergyconsulting.com/blog/category/market-insights/
Excellent Returns Were Produced From PMA’s Summer Model Predictions

As noted in our previous article – Effective Power Hedging, Power Market Analysis (PMA) can also be used for strictly hedging purposes. However the roots of PMA are for power trading. In this article we will examine PMA power trading results for the summer of 2014. We will demonstrate that our model and our advance trade screener have produced numerous winning trades over the course of the summer, generating significant returns with minimal risk.
As illustrated in our previous article, the non-customized PMA trade screener produced a winning portfolio of trades yielding over 10% returns in a month. This portfolio of trade opportunities was developed with no additional tools and insights other than our model calculations. All Energy Consulting believes incorporating PMA with other tools such as weather forecast (e.g., temperatures, rainfall, etc.) and market data feeds (e.g., outages, transmission constraints, etc.) will lead to even greater returns. We believe incorporating that knowledge in our previous example would have likely led to redistribution in the PMA portfolio, producing returns in excess of 20% vs. the 10% demonstrated.
PMA does not forecast weather. However it does run a range of simulations which can be used to predict the various outcomes of the future given changes in weather, gas prices, outages, and more. These sensitivities can easily be customized for your efforts. Using the default changes setup by All Energy Consulting, the model can identify fundamentally-flawed future market expectations, given the likely realities displayed in various future outcomes the model generates. These are the minimal risk trade opportunities identified by the trade screener. The trade screener scans through the various permutations and identifies these minimal risk trade opportunities, allowing one to quickly find a trade to execute.
In this article, we will not only review trades on a physical basis (as presented in the last article), but we also demonstrate the trade screener and how it can be used as a power tool within a financial trading effort to great success. In order to demonstrate the financial trading value of PMA, we will examine our predictions two months out, which was developed by PMA. As in our previous article, our starting date is May 20th 2014. We’ve screened for the trades in July On-Peak. Two value creating trades (both sell recommendations) were identified by PMA, – ERCOT North and Palo Verde – displayed in the screen shot below.

Executing both these of these trades would have yielded an average return of 22%. The results are presented below. In this case, a financial trade to sell ERCOT North and Palo Verde July contract is made on May 20th and then bought back a month later on June 20th.

If the trades were taken to the physical market an average gain of 68% could have been made.

For June 20th 2014 the trade screener found no minimal risk trades two months out. Note: In trading, sometimes it’s best to hold on to what you have.

Our July 21st 2014 screening did produce a set of winning physical trades for August — yielding 13% with three trades. For the two months out trade (September) – PMA showed its first buy signal in a while – NI-Hub On-Peak. On a financial basis that trade was only slightly up as seen below.

As noted previously, the above examples were produced using PMA only, absent of any additional tools such as (weather, market changes, etc.). As also mentioned earlier, integration of additional tools can be incorporated to produce even better portfolio results. All Energy Consulting is willing to team up with trading firms to advise and customize runs and screens to produce a winning power trading book with no upfront cost. This commitment should illustrate our confidence in the value created using PMA. AEC will consider taking a percentage of the profits as our only compensation. Please call or email for more information on this limited opportunity.
All historical runs and reports are online. The above can be easily recreated when you subscribe. We do not hide from our past results. Never be out of touch with the market. PMA is updated daily. Get a 30 day trial for only $1000.
Your Energy Consultant,
David
David K. Bellman
Founder & Principal
All Energy Consulting LLC
“Independent analysis and opinions without a bias.”
614-356-0484
[email protected]
blog: https://allenergyconsulting.com/blog/category/market-insights/
