Year of Model Building 2014
2014 Modeling Efforts
At All Energy Consulting, we specialize in modeling the energy markets. To give you a sense of our capabilities, below are the list of models built in 2014.
Reviewing the list, it reminds me of the saying :
“People who love what they do wear themselves down doing it, they even forget to wash or eat….When they’re really possessed by what they do, they’d rather stop eating and sleeping than give up practicing their arts.” Marcus Aurelius, Meditations
Please do consider All Energy Consulting for your energy modeling needs. I truly enjoy what I do and it will show in my work and commitment to you – Thanks for 2014.
David
[email protected]
614-356-0484
Oil & Gas
-
Built a USGC refinery model in various configurations – Hydroskimming, Cracking, and Coking
-
Discounted Cash Flow Model for Refinery Acquisition and Refurbishment
-
USGC and Caribbean petroleum pricing model
-
Modeled the US Natural Gas Deliveries to Electric Power Consumers by State
-
Modeled and Calculated the discount value for Eagle Ford Condensate
-
Built World Supply/Demand Balance Model for Crude Oil and Petroleum Products
Power
-
Assisted Platte River Power Authority (PRPA) in deployment (setup, build, and operate) of a power model used for their Integrated Resource Plan
-
Several Discounted Cash Flow Model for Power Generation Asset – 800 MW CC to 1MW Reciprocating Engine including the associated power modeling work
-
Worked with the University of Texas Center for Energy Economic on modeling and publishing papers regarding ERCOT
-
Modeled EPA Clean Power Plan and published paper in Fortnightly
-
Modeled and produced a risk analysis for a set of generating assets
-
Long-term Power Modeling along with integrating GCPM gas pipeline model
-
Built and Operate Power Market Analysis (PMA) Platform – includes integrated trade screeners to integrated natural gas storage models.
-
Built an interactive load model for 118 load zones representing N. America
-
Built a coal pricing model to deliver and price coal to all 1000+ coal units in N. America
-
Discounted Cash Flow Model for an Integrated Desalination Plant with Associated Power Generation and Recycle Facility for Waste Water from Fracking
Models are only as good as the inputs and the ability to decipher the outputs to business solutions. More information on modeling and other services can be found on our website.
Best of Market Insights 2014
To my readers, clients, and prospective clients,
I appreciate your feedback throughout 2014. The year 2014 will be remembered as the year of discovery for All Energy Consulting (AEC). An identity for AEC had to be discovered – better late than never. I know I had to work more on delivering my value proposition to you. I have spent so much time on developing products/services plus analyzing markets I lost sight of delivering this message. You will see an enlightened AEC moving into 2015. Our value proposition to my readers and prospects will be clear. I want to share the current thoughts on this in our Branding Positioning Statement:
“For those who need forecasted energy commodity prices, we are experienced market analysts who assist in the navigation of uncertain energy markets with a proven process and methodology, and a collaborative approach in consulting that yields clarity, transparency and empowers decision-making.”
You will see a change in 2015 with a clear direction to support the statement above.
Below are the best of market insights in 2014 rated based on web statistics – page views and downloads.
Your Very Grateful More Focused Energy Analyst – Happy New Years!,
David
614-356-0484
Best of Market Insights 2014:
– With the most page views (60K+) –Peak Energy – Are we there in the US? This is very surprising. Perhaps this is a result of peak oil conspirators or just an error in the web stats. The article uncovers the decoupling of the economy with load in several areas in the US.
– Excellent Returns Were Produced From PMA Summer Model Predictions This article highlights the performance of the generic PMA model for the summer. PMA correctly highlighted the hype from Polar Vortex bleed into the summer forwards. Also should read theBest Winter Trade which yielded 30%.
– Ready for March Gas Demand? Duke’s Merchant Coal Plant Value This article demonstrated PMA flexibility to not only help create risk-adjusted forward curves but also calculate natural gas demand and do specific power plant analysis. We also highlighted our agility with the ability to deliver results within 24 hours.
– US Refining Margins Outlook Sept. 2012 – Wow. An oldie had nearly 20K page views. This article highlighted that condensate production was going to change the markets and that US refining margins will be robust for years to come. Well it was an UNDERSTATEMENT – even though I was probably one of the few analyst mentioning the significance of condensate in 2012 the production of condensate blew past my old outlook. US Refining margins were and will be robust! See 2014 US Refining Outlook
– Most downloaded (403 downloads) – Summer of 2014 Analysis – I threw the kitchen sink and all into this analysis. If you took the time to really digest all of the information in the report you would have been prepared for what transpired in summer 2014.
Calculating the Benefits of EPA Clean Power Plan
If you thought the previous discussions of Clean Power Plan (Paper #1, Paper #2, Paper #3, Paper#4) were complicated, you have seen nothing yet. The benefit discussion of the Clean Power Plan moves into the world of art versus science. This section requires one to delve into philosophy and at the same time, process math. My one semester of philosophy in college perhaps may not cut it, but I will try my best. The most complete discussion of the benefits of the Clean Power Plan is found in the Regulatory Impact Analysis for the Proposed Carbon Pollution Guidelines for Existing Power Plants and Emission Standards for Modified and Reconstructed Power Plants. The title for the report foreshadows the complexity of the subject.
There are two major categories of benefits that are quantified by the EPA – Global Climate Change Benefits and the Air Pollution Health Co-Benefits. For the Global Climate Change calculation, they refer to another long titled report Technical Support Document: – Technical Update of the Social Cost of Carbon for Regulatory Impact Analysis – Under Executive Order 12866. In this report they are running models that have the supposed capability to model carbon dioxide dispersion and global temperature responses which lead to sea elevation changes and agriculture impact. This is certainly a grand model. Once again, the validity of these models are questionable given the lack of documentation of backcasting actual historical years. However, some credit can be given to these models given that they seem well thought out. They even include human adaption profile as climate change occurs. They note adaption is likely, but limited, therefore they mitigate some of the damages being computed due to adaptation. All the calculations were focused on damages and avoided the value of life calculations. The biggest outcome of the report was the following statement: “…climate change presents a problem that the United States alone cannot solve. Even if the United States were to reduce its greenhouse gas emissions to zero, that step would be far from enough to avoid substantial climate change.” Therefore to give a value of benefit of CO2 reduction could be all for nothing unless the world is collaborating. This makes EPA’s claim of the $30 Billion dollars of climate benefit in 2030 very questionable given the lack of global participation to mitigate CO2 emissions in the world.
The Air Pollution Health Co-Benefits, unlike the Global Climate Change, is very dependent on the value of life. As noted in their footnote on many of the benefit tables – “The air pollution health co-benefits reflect reduced exposure to PM2.5 and ozone associated with emission reductions of directly emitted PM2.5, SO2 and NOX. The range reflects the use of concentration-response functions from different epidemiology studies. The reduction in premature fatalities each year accounts for over 90 percent of total monetized co-benefits from PM2.5 and ozone.” This is a very interesting footnote, as this was also noted for the Mercury Air Toxics Standards (MATS). “The reduction in premature fatalities each year accounts for over 90% of total monetized benefits….The great majority of the estimates are attributable to co-benefits from 4,200 to 11,000 fewer PM2.5-related premature mortalities”. Section 4.3.2 in the RIA details the calculation for the Clean Power Plan. EPA notes “Avoided premature deaths account for 98 percent of monetized PM-related co-benefits and over 90 percent of monetized ozone-related co-benefits.” Therefore out of the $25-59 Billion identified in net benefits 90+% comes from premature deaths. EPA noted they used the value of statistical life (VSL) at $10 million in 2030. At $10 Million dollars a life, the reduction of premature mortality amounts to 2,500 to 5,900 less than 0.1% of babies born a year in the US. I have no expertise to argue the merits of this, but I can put this into perspective. Based on the EPA logic, as a society it may be cost effective to require swimming lessons. According to the CDC, 3,533 fatal unintentional drowning occurs per year outside boating related incidents. Using EPA calculation method, this amounts to 35 Billion dollars a year of benefit if drowning could be prevented. If everyone in the US took a group swimming lesson (7 classes) for $66 this could produce a net benefit of 7 Billion assuming ¾ of the deaths could be prevented by attending swimming classes. Consider another perspective. As a society, we should probably invest a lot more in mammograms and screening tools given 10,000 women die a year because of ineffective screening tools. If this could be prevented, a benefit of $100 Billion would occur using EPA calculation. With $100 billion on the benefit side of the equation, many programs and additional screening could be done and still produce a net benefit. Here is one final perspective on the logic employed by EPA for justifying the cost having to do with prohibition. Using this analysis, one could quantify the benefits for banning alcohol based on mitigating alcohol abuse deaths. According to the CDC, 88,000 Americans die each year due to alcohol abuse. Using EPA benefit analysis, almost a trillion dollars would be placed on the benefit side of the equation for prohibition. Does the cost of prohibition add up to a trillion dollars?
If we remove the life portion of benefit, this leaves the Air Pollution Co-benefits of between $2.5 – 5.9 Billion. They did note other benefits they did not quantify, such as health reduction from direct exposure to mercury, SO2, NO2, and CO. In addition, there is value for visibility improvement not added into their benefits. They do not talk about the positive externalities that occur because of low cost power which could be eliminated with this program. This is a point missing in general academia. There are externalities that are also positive as I noted in my previous article.
In conclusion, many of the benefits are questionable, since they depend on global participation, or they are valuing benefits on a value of life calculation which needs to be measured accordingly with other worthwhile life savings initiatives. As noted in my previous article on cost, it would seem the cost is underestimated, and the benefits could be overestimated. The benefits are much more subjective and require a level of knowledge few may have obtained – including myself. Understanding and valuing life plus quantifying a range of externalities certainly require more art than science. Cost, on the other hand, is much more science than art. This subject certainly stretched my comfort zone, but this analysis shows the importance of reviewing the numbers behind the numbers and the value of taking philosophy classes.
Your Ever Willing to Learn More Energy Consultant,
David
David K. Bellman
Founder & Principal
All Energy Consulting LLC
“Independent analysis and opinions without a bias.”
614-356-0484
[email protected]
blog: http://allenergyconsulting.com/blog/category/market-insights/
A Balanced Discussion on the Merits of SB 310 – Throwing the Baby out with the Bathwater?
Summary of Senate Bill 221 and Senate Bill 310
Let me begin briefly explaining Ohio Bills Senate Bill 221 and Senate Bill 310.
SB 221 is a bill focused on increasing the state diversity of energy to cleaner and potentially game changing technology while focusing the state’s consumers on becoming more energy efficient . The bill mandates that a certain percentage of the generation come from advanced energy resources as defined by the State Commission NOT the utilities. This is important to understand. Examples of these sources can come from carbon neutral technology (e.g. modular nuclear, wind, solar, etc.) or technologies that improve how efficiently energy is consumed (e.g. combined heat and power, distributed technology, etc.). Of the advanced energy resources, the legislation calls for half of the targets to be made using traditional renewable sources (mainly wind and solar). The bill also set efficiency targets for the electric utilities to drive the consumers by implanting programs like CFL light subsidies which can be evaluated, measured, and verified by an approved vendor. The targets contained in SB 221 specific to development of advanced energy resources had price caps to prevent significant price increases for the consumer. The efficiency targets do not contain any price caps.
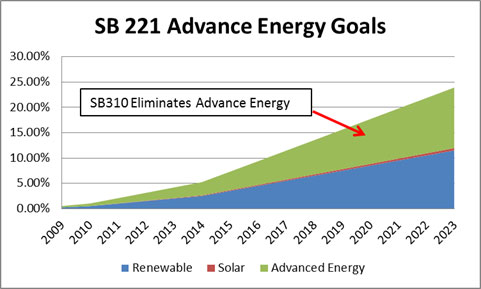
SB 310 is a bill focused on delaying and cutting back on SB 221 mandates. In other words, SB 310 waters down SB 221. SB 310 is designed for the utilities, because it eliminates the portions of SB 221 that threatens the utility business model (more on this later). Everyone seems to focus on SB 310’s 2 year delay of the targets outlined in SB 221 while further studies of its ramifications are conducted. SB 310 also eliminates the advanced energy resource requirement, except for the traditional renewable targets (solar, wind) which remain the same, but are affected by the two year delay. The other advanced energy portions of the bill could have enabled end-users to identify and pursue energy savings opportunities at their facilities within the state.
History of the Bill
As the dust settles on the controversial Ohio senate bill 310, critics and supporters must reassess the situation. Regardless of your position, the bills bottom line impact needs to be understood in dollars for both actual value and potential value so that informed decisions can be made on the bill and its potential changes. As noted above, the bills intent is for diversity of energy and development of new technology. This comes at additional cost that does not always show value right away.
I had previously spent time reviewing Senate Bill 221 while I was the Managing Director Strategic Planning at American Electric Power. SB 221 was passed in 2008 by a 132-1 margin (Republican-controlled House and Senate, combined) and signed into law by former Democratic Governor Ted Strickland. Senate Bill 221 was initially proposed with the good intentions of increasing the state diversity of energy, moving towards cleaner and potentially game changing technology, and becoming more efficient. It would be hard to vote against, hence the 132-1 margin that passed the bill. Given the current design of the utilities and public utility commission, the bill really did not have a chance to be successful.
Issues with SB 221
SB 221 bill only attempts to change the utility, not the commission. The bill adds more responsibility and oversight to the commission, but does not offer any additional budget or suggestions of any action plans to the commission. The bill offers some rewards, incentives and penalties to motivate the utilities to change . The utility typically are slow to innovate and turn change into opportunities, and therefore largely sees only the penalties. “Where there is change there is opportunity” applies to many, but not those who do not want to see change. Given their history of regulation, the utilities need to be nudged into acting more pro-actively . Therefore, bills such as SB221 were needed. However, the commission responsible for the nudging is ill-equipped.
To understand why the utility culture is not designed to capture opportunities of change, one needs to understand the history of regulation. (For more details read Regulation vs. Deregulation Utilities). The utility and Public Utility Commission capabilities are not designed for the new technological world of competitive advanced energy resources and energy efficiency. The utilities failure to innovate largely stems from their incentive structures and historical legacy. The typical consumer wanted reliable power at a reasonable price and was not really interested in the details beyond that. The end-user just wanted to turn on the switch and when the electric bill arrived, they did not want to be surprised.
Utilities have, therefore, worked hard to maintain strong relationships with the Public Utilities Commission since it regulates and approves all utility rate structures. It is no surprise that utilities remain friends with the commission since this keeps the cash flowing to their bottom line. However, when enough consumers react to poor service, the commission could be forced to insist on changes at the utility. This creates a strong incentive for utilities to maintain the status quo, rather than shake things up. Innovation requires some trial and error, which results in increased cost and potential disruptions. The cost based structure, where the Public Utility Commission approves the utility costs and fixed rate of return, does not provide additional rewards for innovation. Thus utilities have traditionally seen zero return for innovation. This mechanism focuses on reliability and reasonable costs, not innovation. This scenario has played out largely unchallenged for decades, but a shift began to occur as a growing group of society started to become more aware of the environment and vocal about repairing and improving it. That movement caught the utilities and the public utilities commissions somewhat off guard . Policy makers moved ahead of the utilities and the commission by implementing policies including SB 221.
The commission’s existing knowledge base was sufficient to oversee reliability while minimizing cost. However, the commission is ill-equipped to oversee an energy industry with new challenges and new technologies. The mandates ask for advanced energy resources and energy efficiency to be implemented with competition and un-bundling in Ohio’s shopping marketplace. Now, there is a tug-of-war between the consumer, the marketplace, and the commission with the utility stuck in the middle. At odds with the commission skill sets, SB 221 is pushing for change . The commission is now required to manage and think beyond current experience. If the commission is to acquire the needed new knowledge and experience, the budget at the commission will likely require an increase, so that they can recruit and retain the right talent to oversee Ohio’s new energy marketplace. Larger utility management teams are making nearly twice as much as commission senior staff. Yet the commission is expected to comprehend the multiple utilities plans cooked up by well-funded teams of experts whose goal is to limit disruptions of the current utility business model. Thus the commission will likely not succeed in effectively regulating policies requiring utilities to change from their current form. Any legislation is only as good as the regulation and enforcement of the bill.
Changes to SB 221 in SB 310
Advance Energy
There are many issues with SB 221. However, these concerns could have been fixed without the drastic change in SB 310. As noted, SB 310 eliminates the advanced energy resources initiative, but leaves the renewable requirements.
The better option would have been to open up all advanced technology and renewable energies under one category. This would have allowed the marketplace to pick the winners of future advanced technology. By eliminating advanced technology, which cover the following: Distributed generation, cogeneration, clean coal technology, fuel cell, solid water conversions, and few others, SB 310 seriously erodes the good intentions of the bill. One of the reasons discussed for eliminating advance energy resource portion of the bill is the lack of progress made by utilities in this effort. However, the lack of progress is largely due to the lack of effort, limited capabilities of the commission, and the desire of the utility to not disrupt the business model.
The utilities only targeted and developed the renewable portion since SB 221 was enacted. The utilities would have you believe there was no advanced technology that was a cost effective option relative to traditional renewable energies. I don’t believe this to be the case. The better reason was because there were no transparent medium to encourage projects that would supply portions of the advanced resource category. Advanced technology is very broad, covering distributed generation to co-generation. The real issue limiting advance technology development was the lack of incentive for utilities to look for these advance technology. They understand the traditional renewable energies and those projects are less likely to hamper some of the utilities current business operation. Distributed generation projects and co-generation options are smaller in scale and directly alter a customer class, potentially causing havoc in tariff structures. The large renewable projects can be uniformly spread across classes. If it was solicited to end-users that the utility would purchase and operate a combine heat and power in their area, thereby lowering their price of power by at least 20% and reducing the environmental foot print by over 20%, I am sure there would be plenty of projects. Advance technology given its very nature will require a change from historic business operations.
Many deals in the power industry are made behind closed doors yet at times they offer competitive advantages. However, given a case where there is a regulated enforcement for certain projects, it would be reasonable to create a transparent pricing platform. The commission could do an initial pre-screen to qualify the projects as advance technology (this still can include traditional renewables) – SB 221 gave them this power. The state would be acting prudently and wisely by allowing commission to approve each new “advance technology” source. Due diligence would still be required from the utility just like every other project. Creating such a platform would prevent the excuse that there are no cost effective advance technology projects available compared to traditional renewable projects. At the same time, it would give commercial and industrial clients, plus developers, an ability to propose innovative projects that could transform a portion of the energy use in the state towards the intentions of the original goals of SB 221.
The abuse of the system would be limited by price caps and volume requirement in the bill. End-users should realize prices would not climb any more than the explicit price caps – “An electric distribution utility or an electric services company need not comply with a benchmark under division (B)(1) or (2) of this section to the extent that its reasonably expected cost of that compliance exceeds its reasonably expected cost of otherwise producing or acquiring the requisite electricity by three per cent or more.” Utilities should realize their business is not required to transform quickly and drastically given the initial volumes are slowly being ramped up plus the cost limits should mitigate some of the rise. Inside the platform, vendors and developers would submit their project information. They would also submit a minimum subsidy value needed to have the project go forward. The various utilities would then bid on the various projects. A sample screen of the platform I have in mind is shown below:
The platform would enable the commission to have a market price to observe the cost of advance technology relative to traditional renewable. This would also enable the utilities to find projects quicker and develop a portfolio for achieving the requirements while staying under the restrictions of the bill. The end-users and developers would have ways to participate in the future of Ohio energy mix.
The other big propaganda for SB 310 was that SB 221 is too costly. Too costly is questionable given the advanced energy resource requirements had price caps as noted above. If the targets are too costly the utilities did not have to achieve those targets. The overarching cost rise was limited to 3%.
There were also cost limits, specifically, on renewables:
“The compliance payment pertaining to the renewable energy resource benchmarks under division (B)(2) of this section shall equal the number of additional renewable energy credits that the electric distribution utility or electric services company would have needed to comply with the applicable benchmark in the period under review times an amount that shall begin at forty-five dollars and shall be adjusted annually by the commission to reflect any change in the consumer price index as defined in section 101.27 of the Revised Code, but shall not be less than forty-five dollars.”
In addition, there were limits on the solar piece:
“The compliance payment pertaining to the solar energy resource benchmarks under division (B)(2) of this section shall be an amount per megawatt hour of under-compliance or non-compliance in the period under review, starting at four hundred fifty dollars for 2009, four hundred dollars for 2010 and 2011, and similarly reduced every two years thereafter through 2024 by fifty dollars, to a minimum of fifty dollars”
However, there was a disclaimer that made the use these price caps quite troublesome – “The compliance payment shall not be passed through by the electric distribution utility or electric services company to consumers. The compliance payment shall be remitted to the commission, for deposit to the credit of the advanced energy fund created under section 4928.61 of the Revised Code. The compliance payment shall be subject to such collection and enforcement procedures as apply to the collection of forfeiture penalties under sections 4905.55 to 4905.60 and 4905.64 of the Revised Code.” This basically directs the utility to implement more expensive programs to avoid the compliance penalty since this was not a legitimate bridge.
Those supporting SB310 for cost reasons could have sought adjustment of the above cost numbers versus throwing the entire advanced energy requirement out of the equation. A simple rewrite of the compliance payment could have also assured the utility never spent any more than allowed. The one area which was left open to unlimited cost was the Energy Efficiency and Demand Side Management (EE/DSM) programs. As with the alternative energy requirement, a price cap should have been established in terms of rate increases from EE/DSM programs. SB310 still does nothing to address future cost of EE/DSM programs.
Energy Efficiency (EE)/ Demand Side Management (DSM)
The EE/DSM arena is a scary place given its spectacular growth. As noted in my Clean Power Plan review paper #3 , the industry has grown significantly from $1.6 billion in 2006 to $5.9 billion in 2011 and projected at over $8 billion (figures from the American Council for an Energy-Efficient Economy). With that much money in the system in such short time and the fact that the industry depends on estimates, there is bound to be “corruption” unless there are good checks and balances. EPA notes this in their discussion of EE/DSM – “Regardless of how the energy savings of an energy efficiency measure are determined, all energy savings values are estimates of savings and not directly measured”.
I am a supporter of energy efficiency and conservation programs having seen some fantastic data and work while assisting the Northwest Power & Conservation Council. However, I have also seen the darker side while assisting a utility in Indiana and reviewing some of the AEP plans. The companies who are in charge of evaluating, measuring, and verification are typically working in all three spaces. I have seen an evaluator in one state who acted as a measurer in another state. This cannot be allowed. Given that many utilities get shared savings, they are somewhat indifferent in this discussion. Shared savings is an incentive mechanism created to align the utilities with reducing energy usage. In the traditional regulated format, the utility only gets a return on capital investment, which incentivizes the utility to grow energy usage. If demand is falling, there is less likely any need for capital investment. Shared savings allows a utility to share in the savings of an efficiency program by collecting a certain percentage from the reduction of energy usage. Therefore, when an evaluator approves a plan the utility proposed, and the measurer and verifier support it, the utility would not oppose the assumed large savings in kWh, even though it may not be real, because the cost difference and savings are shared with the utility. The bigger the saving, the more the utility gets back. The only consequence is the load forecast will typically be too low and the rate payer is stuck paying more for plans that really add no savings. Most of the time, the commission is not equipped to understand the nuances in the EE/DSM program, so the utilities can bring in their expensive lawyers and impressive EMV. Before you know it, the programs is approved. The last leg of defense in an overwhelmed commission is the consumer protection council, which was cut in half by Kasich in 2011, even though they received their pay from the utilities, not the state budget. This was in the year they saved the rate payers significant amounts of money and was a true thorn in the utility. “The Supreme Court of Ohio ruled 7-0 in its April 19 decision that the PUCO improperly allowed AEP to charge customers unlawful and unreasonable rates. The Court ruled in favor of the OCC in agreeing that AEP’s 2009-2011 rate plan was unlawful by including $63 million in retroactive rates, $456 million in costs to potentially provide default service for customers who shop for an alternative supplier and $330 million in carrying charges for environmental investments.”
The energy efficiency cost you are currently paying can be easily computed from your bill if you belong to AEP. They post the calculation of your rate. Download the excel file and enter your information and review the corresponding sheet that represents your profile. In my case, I am paying $5/month or a total of $60/a year to pay for the energy efficiency program. The residential energy efficiency program is essentially reducing subsidies with a little portion for O-Power. O-Power is a report, telling me how much more I consume relative to my supposed comparable house. Is it truly worth $60/a year to subsidize light bulbs and a report to tell me my consumption relative to other houses? What alternative light bulb would I buy if it wasn’t for the subsidy? Does it achieve the value that the measurer and verification company is stating? In this case, my rate is being impacted nearly 4% by this program.
Better oversight is needed in the EMV space for EE/DSM. Some worthwhile programs can be found in the data, which are likely around 50-70% of the total programs. Many other programs are predominantly number tricks, enabling the EE/DSM industry to support itself and grow. SB 310 should have addressed price caps and better oversight EE/DSM.
Other Changes
SB 310 still carved out a solar requirement in one of the cloudiest states in the country. I think, in large part, the belief was if you had a solar mandate, solar manufacturers would come here. There is enough solar demand in the US market that if the state of Ohio could create a supply chain and manufacturing advantage, they would come here to manufacture and even to export to other states. China is a leading manufacturer of solar not because they placed a solar mandate.
SB 310 also ended a requirement that utilities purchase half of their renewable energy from within the state. This, in effect, produces a subsidy to other states. The purpose of the renewable program for many was to stimulate economic development. As I noted in the solar argument, mandates do not stimulate manufacturing, but if you are going to have a mandate, you might as well force some of the development in the state – or don’t have the mandate at all. One cannot criticize too much on cost given the price caps for cost in renewable compliance.
SB 310 does create a committee – “There is hereby created the Energy Mandates Study Committee to study Ohio’s renewable energy, energy efficiency, and peak demand reduction mandates.” The study will cover 8 objectives which I will give my precursory estimate of the results:
(1) A cost-benefit analysis of the renewable energy, energy efficiency, and peak demand reduction mandates, including the projected costs on electric customers if the mandates were to remain at the percentage levels required under sections 4928.64 and 4928.66 of the Revised Code, as amended by this act;
DKB: Cost for the renewable piece will not rise any greater than the 3% required by the bill. EE/DSM mandates are questionable in cost and delivery of actual kWh savings. The current system over accounts 10-40% energy savings, therefore better checks and balances will be need in the EE/DSM arena. Recommend putting a cost rise limit with EE/DSM as with the renewable goals.
(2) A recommendation of the best, evidence-based standard for reviewing the mandates in the future, including an examination of readily available technology to attain such a standard;
DKB: Having qualified commission staff and consultants with significant experience in the region along with some power modeling experience to analyze future mandates.
(3) The potential benefits of an opt-in system for the mandates, in contrast to an opt-out system for the mandates, and a recommendation as to whether an opt-in system should apply to all electric customers, whether an opt-out system should apply to only certain customers, or whether a hybrid of these two systems is recommended;
DKB: If the commission wants to guarantee savings from current structure an opt-in is applicable. However education is the key for consumer actions.
(4) A recommendation on whether costs incurred by an electric distribution utility or an electric services company pursuant to any contract, which may be entered into by the utility or company on or after the effective date of S.B. 310 of the 130th General Assembly for the purpose of procuring renewable energy resources or renewable energy credits and complying with the requirements of section 4928.64 of the Revised Code, may be passed through to any consumer, if such costs could have been avoided with the inclusion of a change of law provision in the contract;
DKB: This is a very slippery slope. Adding contracts with change of law would result in significant risk premiums. Creating sustainable laws is a better answer.
(5) A review of the risk of increased grid congestion due to the anticipated retirement of coal-fired generation capacity and other factors; the ability of distributed generation, including combined heat and power and waste energy recovery, to reduce electric grid congestion; and the potential benefit to all energy consumers resulting from reduced grid congestion;
DKB: The conclusion will reflect how much the utilities influence the committee. Based on my experience, CHP and distributed generation can play a significant part. Not only do they offer energy savings by being close to the demand source and using the heat, which is not used at all at centralized plants, they offer resiliency to the grid and can be used to support the grid in times of need.
(6) An analysis of whether there are alternatives for the development of advanced energy resources as that term is defined in section 4928.01 of the Revised Code;
DKB: There is always room for alternatives and innovation – this is the USA. Governments can play a role in nudging development without overly committing by using price caps such as in SB 310 and SB 221. The fear of transformation only comes from the incumbent who does not want change. A marketplace platform could offer market transparency and a place for end-users and developers to participate in the evolution of the energy industry.
(7) An assessment of the environmental impact of the renewable energy, energy efficiency, and peak demand reduction mandates on reductions of greenhouse gas and fossil fuel emissions;
DKB: Estimation should use a dispatch model to produce these figures since the commitment of the units will likely change particularly if the load curves flatten. A flat load curve is actually to the benefit of the coal units. Ohio is a net exporter of electricity, so bordering states programs will be of significant influence.
(8) A review of payments made by electric distribution utilities to third-party administrators to promote energy efficiency and peak demand reduction programs under the terms of the utilities’ portfolio plans. The review shall include, but shall not be limited to, a complete analysis of all fixed and variable payments made to those administrators since the effective date of S.B. 221 of the 127th General Assembly, jobs created, retained, and impacted, whether those payments outweigh the benefits to ratepayers, and whether those payments should no longer be recovered from ratepayers. The review also shall include a recommendation regarding whether the administrators should submit periodic reports to the Commission documenting the payments received from utilities.
DKB: If they really audited this, I think they will uncover quite a bit of dirt. Once again this is not due to the efficacy of the mission, but to the fact the industry has grown so rapidly and there is just so much money now.
Politics SB 310
Lastly, I want to address the politics of SB 310. Many insiders deem SB 310 as the First Energy Corporation bill. Rumors express a concern that some of these programs were causing a drop in capacity prices in this region. Given that First Energy coal fleet is deregulated, this was a big concern for them. Mathematically, this would occur, but the volumes from SB 221 at this time are too small to have a significant impact. The real drop in capacity prices was a function of the aggregators in other parts in the PJM markets, the MISO imports, and stagnating demand which drove the capacity price down. Dropping of advance technology resource requirements would have only threatened the utilities. No one else would have been detrimentally impacted by having the advance energy resource option given the price caps – unless you think 3 percent is too much to pay for diversification – perhaps 2 percent? I believe Distributed Generation and Cogeneration incentive mechanism provided a threat to the utility that they did not want to risk taking on. SB 310 is a bill to leave no utility behind, but at the cost of potentially stagnating advancement. The keyword is potential – it is possible that nothing would change, but a cost of 3% may have been worth the risk. A positive, I see from SB 310 relative to SB 221 is the dropped responsibility of the commission. They don’t have to understand the potential advance technology. They lose a key oversight piece “For the purpose of this section and as it considers appropriate, the public utilities commission may classify any new technology as such an advanced energy resource or a qualifying renewable energy resource”
Conclusion
In conclusion, the major weaknesses of SB 221 were not improved and the intent of the bill weakened in SB 310. I regret I did not have time nor was asked to review SB 310 before the bill was signed. The impacts of SB 310 will benefit a few. The few are mainly the utilities. It is possible End-users may save some money with SB 310 relative to SB 221, but the savings likely will not amount to much given the potential gains of transforming the energy mix for Ohio to be more resilient and environmentally friendly. The next adaptation to the Ohio energy bill needs to re-introduce the advance technology portion found in SB 221 and create a mechanism for success by increasing the commission’s budget and the development of a clearinghouse platform for advanced technology. Other adaptions include adding a price cap on EE/DSM similar to the alternative energy source option, greater oversight of EE/DSM programs, and fine-tuning the compliance costs to give more flexibility for the commission to modify and utilities to be able to recover some of the alternative compliance payments.
End-users are still left with many other uncertainties including the recent EPA Clean Power Plan to mitigate CO2 emissions. If you are an end-user trying to understand the future of power, I can and will be able to help you navigate through the storm of uncertainty. I have many years of experience in forecasting and developing risk mitigation strategies in the energy industry. I am always up to date in current markets and offer a daily forecast of all North American power hubs. This product is being used by hedge funds and utilities.
Your Enthused and Optimistic Energy Consultant,
David
David K. Bellman
Founder & Principal
All Energy Consulting LLC
“Independent analysis and opinions without a bias.”
614-356-0484
[email protected]
blog: http://allenergyconsulting.com/blog/category/market-insights/
Assessing the Cost of EPA’s Clean Power Plan
In order to understand the following, one needs to have read the Clean Power Plan and/or read the 3 summaries I put together of the Clean Power Plan (Paper #1, Paper #2, Paper #3). Reading those three will allow you to get an understanding of the areas of cost that I plan to discuss below.
The Clean Power Plan notes the cost metrics in consumer terms: “Under Option 1, average nationwide retail electricity prices are projected to increase by roughly 6 to 7 percent in 2020 relative to the base case, and by roughly 3 percent in 2030 (contiguous U.S.). Average monthly electricity bills are anticipated to increase by roughly 3 percent in 2020, but decline by approximately 9 percent by 2030. This is a result of the increasing penetration of demand-side programs that more than offset increased prices to end users by their expected savings from reduced electricity use.”
In demonstrating the cost metrics in utility terms, they offer a significant amount of disclaimers “The compliance assumptions – and, therefore, the projected compliance costs – set forth in this analysis are illustrative in nature and do not represent the full suite of compliance flexibilities states may ultimately pursue. These illustrative compliance scenarios are designed to reflect, to the extent possible, the scope and the nature of the proposed guidelines. However, there is considerable uncertainty with regards to the precise measures that states will adopt to meet the proposed requirements, because there are considerable flexibilities afforded to the states in developing their state plans.”
The EPA estimated compliance cost states “The EPA projects that the annual incremental compliance cost of Option 1 is estimated to be between $5.5 and $7.5 billion in 2020 and between $7.3 and $8.8 billion (2011$) in 2030, including the costs associated with monitoring, reporting, and recordkeeping (MRR).” The key word in the statement is annual. These costs can be expected each year. The EPA noted this is based on the difference to their base case, but was not explicit in their base case assumptions.
There are significant moving blocks, and the ability to model all of these options take time. In order to speed up the process, I approach the problem focused on the existing fleet and current load projection for 2016. Using 2016 will essentially show the remaining fossil fleet that is likely going to be impacted by the Clean Power Plan. This part of the analysis is centered on BSER 1 & 2 (plant efficiency improvement & redispatching). The targeted CO2 values for each state existing fossil fleet were extracted from the EPA model assuming BSER 3 & 4 (Non-Carbon Generation and Demand Side Efficiency) will deliver as EPA projected. Out of all the blocks, BSER 1 & 2 are the most tied to the market place given their impact is on the existing fleet. The BSER 1 & 2 represents almost 40% of the total rate reduction.
The models I am using are very sophisticated and robust. These models are used to make financial decisions in the current market place for both gas and power markets through the product line – of Power Market Analysis (PMA). The base dispatch model is the AuroraXMP model by EPIS. The entire N. America is being modeled. A significant amount of work was needed to produce a model that is applicable to today’s market.
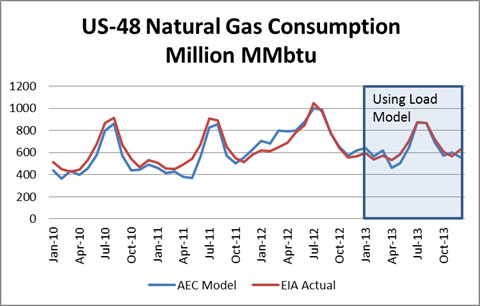
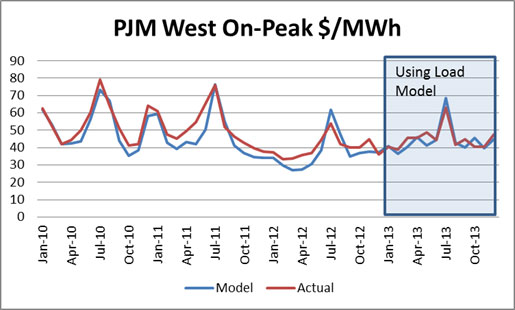
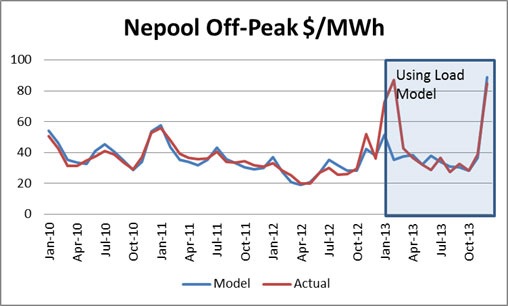
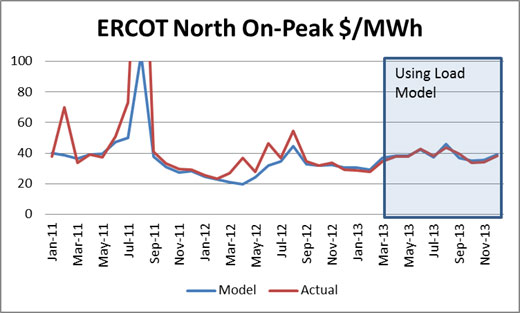
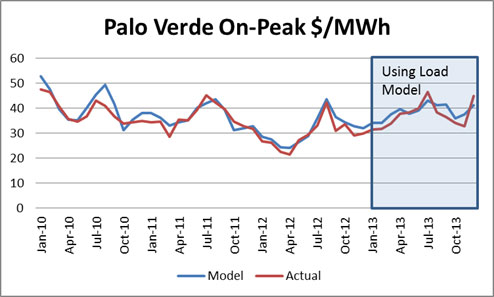
Validation of the model is continually being done. If your consultant is charging to see validations or has not done one in some time I would be skeptical on the results. Below are a few graphs validating my process – many more available per request:
These large models as used by the EPA – EPA used the Integrated Planning Model (IPM), developed by ICF International – I have always been interested in their ability to backcast the actuals on a monthly basis using their forecast methodology. Without first presenting and establishing the model tendency how do you know that the model can forecast? It may not be the model, but the data inputs the user is applying to model which could result in wrong output. Many large models typically make the excuse they are not interested in the daily or monthly changes, but want to show the “high” level impacts. I would be cautious on the ability to calculate economics in the market at that point.
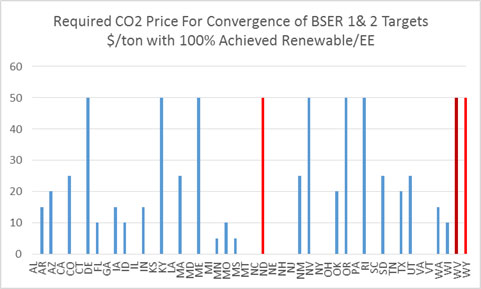
The simulations were all based on the forward curve prices published on June 5th 2014. After around 14 iterations I was able to reach an acceptable convergence to produce the state rates suggested by the EPA through re-dispatching with individual state CO2 price being the variable to target state rates. There were 3 states that could not converge to an acceptable level so I left them at the max of $50/ton. There are 21 states where the price of CO2 was essentially zero – see chart below. Significant renewable and DSM and the retirement of coal units in these states drove them to essentially not have to alter their dispatch to achieve the state targeted CO2 rate.
In addition to EPA “optimize” case, I ran a case with only 60% of the renewable and DSM/EE. This is reasonable case in the sense the EPA guideline for BSER 3 & 4 are based on non-empirical goals (State Renewable Program Goals and Other State Experiences). I discuss the concerns of this method in Paper #3. Nonetheless, I do believe more than half of the expectations can and will be achieved – hence I chose 60%. This obviously dropped the targeted rate with some as low as 60% of the initial targeted rate. In the 60% case there were 6 more states that hit the maximum $50/ton case. There were only 15 states with zero carbon cost – See Charts Below.
Note Illinois did not require any carbon cost in both cases. Ohio actually fared well because the utilities had to burn through many of their coal plants in 2012 even though it was uneconomical, and scheduled retirements in 2014-2016 help achieved the targeted rate. The big question for Ohio is can they achieve their renewable target. I have done a state by state report plus added a feature to be able to extract particular units within the state to inform you. A sample file for Colorado is available. If interested please send me your state(s) interest and the amount you are willing to pay for this highly informative report. Also add a note if you want a particular group of assets evaluated.
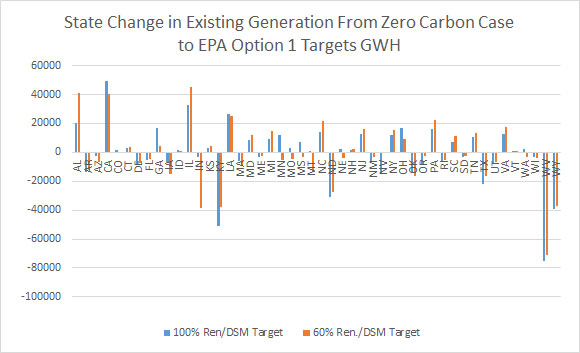
The runs did produce a list of winners and losers in terms of existing power plants. As an existing power plant you want to be in Illinois, Alabama, and California not Kentucky, Indiana, or West Virginia – See Chart Below
In theory, the quantification of just BSER 1&2 cost would be below the actual cost of the total Clean Power Plan. The other parts of the program involved new creation. In most cases, an existing already paid for resource cannot be economically challenged from new items including many DSM programs. The 2016 run already retires many of the uneconomical units. The below chart shows the impact of wholesale power prices as a result of “forcing” redispatching to achieve target.
Wholesale power prices increase 20% in the 100% BSER 3&4 case and in the 60% BSER 3 & 4 case almost 40%. The way power prices are set, the marginal unit sets the price for all units in a given hour. Therefore, even if you bid into the system at $5/MWh, if the marginal unit (the last MW to fill the required electric demand of the system) is $100/MWh, you will get $100/MWh. In a regulated framework, this is less important since the structure is built on cost and depending on if there are outside shareholder additional returns (8-15%). Given the EPA statement, “retail electricity prices are projected to increase by roughly 6 to 7 percent in 2020 relative to the base case” & “Projected wholesale electricity price increases over the same period were less than seven percent”, I am not sure they are appreciating the deregulation impact. The 7% does align with comparing my fuel cost from the increases seen in the various cases. However, I did not change the fuel prices even though EPA analysis did show this would likely happen – increase gas price and lower coal price. The cost world is generally gone in the generation space. Generators below the marginal power plant will keep all the gains vs. being satisfied with a cost basis. The box on de-regulation is open and not likely to come back.
Energy revenue for the entire system went up $130 Billion in 100% BSER 3 & 4 and $243 Billion in 60% BSER 3 & 4. There are still systems that are fully integrated therefore will not capitalize on the opportunity to charge more to the customer. There is no doubt the cost of the power price impact will be much greater than noted by EPA.
As pointed out several times, this is the piece involved in the existing fleet which is an integral part in achieving EPA Clean Power Plan CO2 rate targets.
There are several points made by the EPA alluding to cost being reduced due to energy efficiency – “Average monthly electricity bills are anticipated to increase by roughly 3 percent in 2020, but decline by approximately 9 percent by 2030. This is a result of the increasing penetration of demand-side programs that more than offset increased prices to end users by their expected savings from reduced electricity use.” This is true for some, but not all. The other half of the system (transmission & distribution) is still regulated. The programs are not free. They do cost money and must be paid for. The local distribution company can save when you are efficient in not causing large capacity payments and/or limiting inopportune times of buying power (high demand periods). This has been known for many years. As users become more efficient the regulated group still is promised the cost of operation. The only means of collecting the cost is charging users of electricity. As usage goes down, the cost collection goes down. Therefore, rates go up to compensate. The issue will become creating balance programs so that the wealthier who can afford the programs do not cause the rest of society to pay more. The regulated world is a zero sum game even more so without the generation piece.
It is easy to calculate the cost of the renewable piece. I have a state by state sheet showing the various targets set forth and calculating the cost using conservative estimates on the cost of wind and its performance. The renewable piece will be easily $200 Billion which comes out to be $11 billion a year. This makes this statement very confusing “The EPA projects that the annual incremental compliance cost of Option 1 is estimated to be between $5.5 and $7.5 billion in 2020 and between $7.3 and $8.8 billion (2011$) in 2030” Perhaps the rationale for difference is the base will already have that cost built in. However, with low gas prices and a lack of incentive, such as a carbon price, I don’t believe the renewable levels would be achieved to the extent the EPA is targeting. Even half the difference still shows the capital cost to be low. The DSM/EE programs do cost money. The higher power prices will cost the local distribution companies more and the generators who are left to compete are not going to send a bill that is cost plus.
Though the cost is higher than EPA projects, the benefits may still be there. In the next and final synopsis on the Clean Power Plan, we will review the benefits.
As noted previously, I have spent significant hours analyzing and modeling the Clean Power Plan Act with no payment from any source for this effort. The big driver in taking on this task is my personal intellectual interest. There is hope I can monetize some of my work. I do have the state by state report which I am hoping will be of interest – State of Colorado sample. Plus I can do a fleet analysis if you want to know how your assets will perform in this new world. I can also assist in developing a strategy to not only survive but to capitalize – where there is change there is opportunity.
Please do consider me for your energy consulting needs.
Your Inspired Energy Consultant,
David
David K. Bellman
Founder & Principal
All Energy Consulting LLC
“Independent analysis and opinions without a bias.”
614-356-0484
[email protected]
blog: http://allenergyconsulting.com/blog/category/market-insights/
Fact Check – Solar Land Space Needs
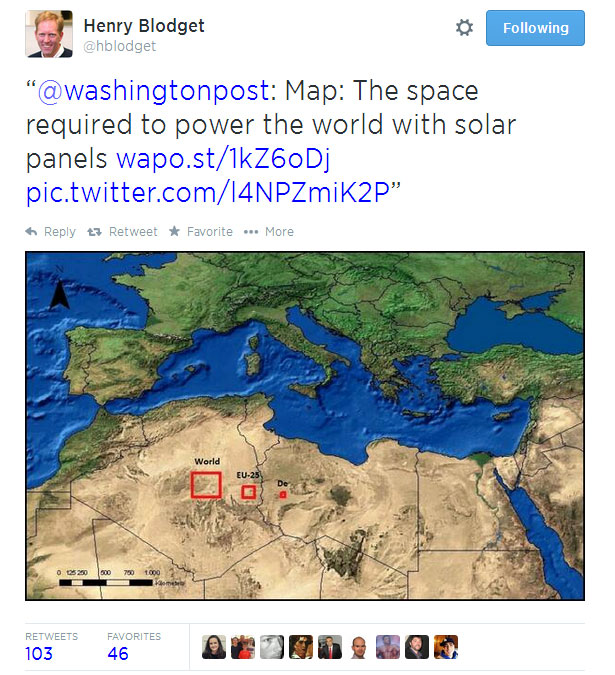
I am still working on reviewing the EPA Clean Power Plan analysis (Paper #1, Paper #2, Paper #3). I am currently running multiple dispatch simulations to produce an impact analysis using AuroraXMP. However, I got distracted from a twitter blog that showed the solar land requirements for the world to be extremely small. See blog screenshot below.
I traced the source to this paper from a student who wrote it for their Diploma Thesis. On page 11 & 12 of their report are the claim and the graphic being spread on the internet. The first issue which should jump out is the statement “If a solar electricity yield of 250 GWhel/km² is taken as base ….” Doing a little research one can conclude at best that yield is off by 3X per the latest by National Renewable Energy Laboratory (NREL). In addition, the world electric consumption seems to be a little low in the assumption used 16,076 TWh/y vs. 20,280 TWh/yr.
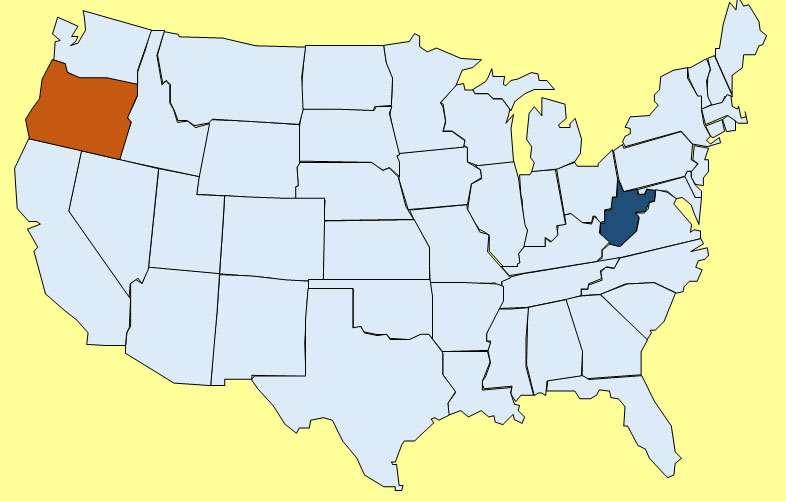
If we recompute the numbers using a low estimate of land use per NREL of 3 acre/GWH-yr, the state of Oregon becomes the world size requirement versus the analysis which was closer to the size of West Virginia. West Virginia is more represented of the US requirement. This is not including the need to get battery storage and transmission. Battery storage size would be much smaller – less than Rhode Island. However land requirement is only one piece of the puzzle. Data source for state area.
The initial capital cost of such endeavor would be at least twice as large as using natural gas generation. Utility scale solar cost is at best around $2000/kW – then a utility scale battery would add another $500/kW versus a brand new gas plant which is around $1000/kW. The gas plant does have a significant variable cost, but as many of you know who have to budget your money, the best decision for the long-run sometimes cost too much given your current capital constraints. The trend for de-regulation for the generation business puts a greater limit on the ability to make these longer term decisions.
Lesson learned always check your facts when it comes to energy related discussions. It is too easy to manipulate the facts, because there is so much data and few go deeper to find the truth. The truth shall set you free.
Back to EPA analysis – stay tune….
Your Energy Consultant in Search of the Truth,
David
David K. Bellman
All Energy Consulting LLC- “Independent analysis and opinions without a bias.”
614-356-0484
[email protected]
@AECDKB
blog: http://allenergyconsulting.com/blog/category/market-insights/


