“Prophesy is a good line of business, but it is full of risks.” Mark Twain

It has been quite some time since I have posted an article.
The end of the year is a good time to reflect on past prognostications. I do have a list of publicly made prognostications. Of course, my most famous prophecy was the collapse of the oil markets in 1998. I was noted in several publications including front page USA Today. Since then, given my move into the real world from consulting world, my prophecies have been privy to the companies at which I’ve worked. However, you can find some public appearances at conferences where my prognostication skills can be bench marked to reality, I have dug up two from the past – one in 2011 and another while I was running my consultancy in 2015. Both, coincidentally, were at a Platts conference. I seem to do quite well at Platts conferences – perhaps I should be presenting more often there. Last, but not least, the latest news of auto manufacturers layoffs and cutting models made me go back to one of my previous blogs I posted.
The last public statement was made at the Platts Refinery Conference back in 2015. Right after that, I was implementing PMA at EDF Trading. At the conference, I was not given much attention as many of my ideas did no support the on-going trend and sentiment. In addition, I hadn’t spent a lot of time back in the refinery industry – but to be honest, its really not as complicated as power – for me it was easy to pick back up where I left. I rebuilt supply/demand models for each commodity. Reviewed and traced each demand and supply sector and examine key inflection points. I also followed up with respective experts/leaders in each product and had wonderful conversations with them. An expert with passion can’t stop talking :)! Please click on this link for the 2015 Platts Refinery Conference Presentation. I started my presentation noting how all the experts in the industry over the past decades have gotten major trends wrong and I wasn’t excluding myself (e.g. lighter crude slate – peak oil etc…). Many in the rooms did not like to hear this. However, if you ever get a consultant/expert to not review and face the facts of the past and admit their errors – run – run as fast as you can. An over confident consultant/expert can cost you a lot more than their fee. I discussed the current landscape with all the new oil and gas production and how ethane will need to find a new home. Currently ethane exports are almost at my 2024 foretasted export level! Also noted was the possible Naphtha issue and the two chemical feedstock would inevitably collide in the market. All of it came true, and the extent was even more than the tempered forecast I presented. I am a realist in the sense there is no reward to forecasting way above consensus – just being away from consensus is enough to get the point. I had an inclination that the situation could be much more dire than I presented, but I was already going against the grain so I tempered the expectations in the presentation. Creating scenarios also allowed the visuals of the direction of the market – note the high case.
Going even further back is a presentation I gave at Platts Coal Conference in 2011. I was in a similar situation where I had to relay a bad message to the room – and once again, many did not want to hear it. To view the presentation click on the following link – Platts Coal Refining Conference in March 2011. I noted my calculations of coal retirements made when I was Managing Director Strategic Planning for AEP – which was available in the public documents in one of the AEP Analysts meetings presentation. Essentially I was telling the audience that almost 50% of their demand might go away and that exporting would not solve their financial situations. Of course, no one in the coal conference wanted to heed my warning. The KOL etf had already dropped from highs of 50 in the year to 30’s in October 2011. I heard from some that this David person had no idea what he was talking about – because I was a power guy not a coal guy. Hmmm… when most of your demand is from the power sector shouldn’t that be the person you should be listening to? Anyways, the KOL etf is now 12 and we have seen some major bankruptcies in the industry. Export coal is up in volumes but just not even close to drop of volumes from US coal generation. The surprising reflection to note is how well the rail sector has done – perhaps replacing coal with oil and continued Chinese imports – but at some point that will likely end, too.
The latest news of auto manufactures laying off and cutting models made me think of an article I posted back in Feb 2015 which I reviewed the BP Energy Outlook. If only the auto guys took heed to my warnings – “…eventually with the falling prices and the improved efficiency improvement the auto manufacturer can produce an SUV with mass appeal and size that can go 0 to 60 in few seconds yet offer 25-40 mpg. Auto manufacturers who ignore this trend will be left in the dust as was seen last time SUV sales outsold compact vehicles. The move to this larger and faster car will swallow the small vehicles leading to overall growth in oil demand while maintaining the CAFE standards.” US total petroleum demand almost re-hit its monthly peak demand set in August 2005. Overall US petroleum demand has been in an upward projection since bottoming after the financial crisis.
There are many out there denying the ability of human beings to predict/understand the future. Books like Undoing Project by Micheal Lewis and the conclusions that Israeli psychologists Daniel Kahneman and Amos Tversky demonstrated that humans have a breakdown in their psyche creating poor decisions and inefficiencies in the market. They did not examined learned/experienced forecasters and also did not reach out to successful prognosticators. Much of their tests involve normal sample people, not experienced and trained-to-forecast individuals. We are also seeing the rise of AI and neural networks to take the human psyche out of the equation for decision making. However, it is the human that can relate to the human that is making decisions, even if the human is using AI. So far, I have yet to see an AI be able to go beyond short term analysis given its learning sample is always based on the past and the multiple forward inputs still require some creativity and art for which only an experienced person can create. I good benchmark for when AI is ready is when AI starts making art work so profound. At that point, I would say human prognosticators could likely be looking for another career, but until then – For my fellow aspiring prognosticators I leave you with these tips in order to be a better forecaster.
- One. Get a real job in the real industry and eventually in the planning and strategy group. Being a consultant your entire career leaves out the feedback loop of reality and you end up in this strange world of advice giving and not knowing how it really matters to the company and the multiple lives you could impact. This is also a note to companies hiring consultants – get one that has been in the industry in a position of planning/forecasting. They will understand your position best and know the bigger picture of what an outlook/position could mean to you and your company.
- Two. Have a fundamental foundation – examine as deeply as you can the drivers of supply and demand e.g. what are the economics parameters that drive more supply? When and how much does demand respond to price? What alternatives are there? etc.. The devil is in the details – get your hands dirty and get into the details. This is where IF you have passion, it will shine. IF you want to be the best, this is where sacrifices are made. Work longer – sleep and dream the problems – let nothing get in your way – if you really want to understand the market your forecasting. If you don’t, I promise you someone else will, and you won’t be getting it right consistently. Forget all those that say you must sleep so much and rest so much – I believe, when your in the midst of an issue, you must engross yourself and get your rest and leisure later. Nothing worthwhile that can be claimed as a great achievement comes without sacrifices. My first professional boss at Purvin & Gertz, Ken Miller, taught me about having passion for your work. His life was his work. He would carry the largest suitcase full of reading materials everyday. I have never stopped reading as much as I can because of him. He passed away this year, and may he rest in peace – but, knowing Ken, his rest would be reviewing refinery economics. Everyone should have such a boss with so much passion. There is so much that I owe him for showing me the way.
- Three. Be humble – know that you don’t know everything nor do you have to. In the mid 2000’s, I knew gas couldn’t just rise to the teens without something in between. Did I know it was shale at the time? No. But, I did know the principle of greed and human ingenuity. My premise to pull the prices down from the every growing forward curve came from the underlying thought of greed and human ingenuity, and I used LNG as my placeholder. In my calculations, at the very most, prices would be around $6-7/mmbtu. In the end, we see the development of shale was the ultimate greed and human ingenuity mechanism pulling gas prices back down even farther than I foresaw at that time. However, my premise was still right. It was not ever growing as the forward curve/market thought, and I didn’t have to know everything to save the company billions of dollars from jumping into more coal assets and not buying distress gas assets that later sold for multiple times on the dollar. It is so important to reach an understanding at some point in your career that no matter how much modeling and research is done, the world will unfold not even close to many experts predictions. With that humbleness you will open your mind and begin to, more accurately, prognosticate. You will realize and be more open to multiple outcome probabilities. Having ranges of outcomes does not make you weak, but makes you cognizant of the multiple dependencies that are out of your control e.g. weather. However, you will still need to have a base forecast to discuss where things are likely headed as long as all the dependencies likely head your direction.
Over the years, I have come to the realization that humble, but passionate, consultants are the best consultants, as they have been weathered and understand some of the unpredictable nature of the past and very much willing to put in the effort required to maintain expert status. They are confident enough to change their forecast before it is too late and also be brave enough to forecast against the trend.
May you have a prosperous 2019 – and stay thirsty to knowledge!
David K. Bellman
Your most humble, super passionate, and grateful but very lucky prognosticator of the energy market!
Clean Power Plan will Double Coal Retirements Unequally
The article I wrote in the October 2014 issue of Public Utilities Fortnightly “EPA Clean Power Plan – An Unequal Burden” (Click for free copy) has been cited in numerous responses by commissions around the country. In this article, I will clarify the intent and introduce another layer of analysis.

The analysis was not funded by any entity. The development of the analysis came from pure intellectual curiosity and the enthusiasm of solving a puzzle. All Energy Consulting has not received any payment or business as a result of the analysis done on EPA Clean Power Plan. The article is not intended to argue the merits of global warming. The article is also not intended to absolutely quantify the cost of the plan. The main intention of the report was to demonstrate that the cost of the plan will vary significantly among the states. In order to do this, as noted in the article, we used the implicit EPA calculations for Blocks 3 & 4. In addition, we used our highly sophisticated and very well calibrated power modeling platform – Power Market Analysis (PMA). PMA is used to quantify risk in the futures power markets for hedge funds to end-users. PMA was used to calculate an impact of Block 2. Block 2 per EPA involves the re-dispatching of the system with gas generation over taking coal generation. PMA uses the software AuroraXMP by EPIS which allows us to input our knowledge in a relative easy manner and produce numerous runs in a short time span. We had to produce hourly dispatching results for the entire N. America with at least 15 plus simulations to produce the analysis. For the analysis, we re-dispatched the system using state by state carbon prices in order to achieve the CO2 emission rates targeted by EPA for Block 2 – see process flow figure below.

There are limitations with this analysis for use outside the intended use of demonstrating large economic disparity among states as result of the Clean Power Plan. Given our goal of showing large differences in state economic impacts, we did not do a full cost analysis of the plan. EPA simple analysis did not do this either. They just assumed the substitution of generation from coal to gas would be sufficient given the perceived underutilized capacity factors of gas plants. However, a full cost analysis of the plan would involve an iterative approach to retire units no longer economically sustainable. As the CO2 costs rise, many of the existing units no longer produce enough power to be economically supported given their fixed cost of operation. This leads to retirements in the system. There will be stranded cost issues with early retirements of plants. Our initial analysis did not go that far. The cost derived from CO2 prices to drive those retirements represents a conservative cost that will occur in order to substitute with new technology. In many cases, the cost will even be higher than the CO2 impacts of driving units – mainly coal – out of the system given replacement power needs an economic hurdle to get a project developed. We can certainly do this analysis at All Energy Consulting, but we were limited by time and the need to pay the bills. Given this analysis was done free of charge, and our intellectual goal was to demonstrate large state disparity, we were able to achieve this without a retirement sequence analysis.

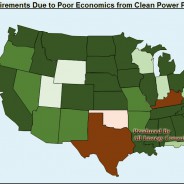
We were given more time recently and did do the next sequence of the analysis –once again for pure intellectual curiosity – no payment. Taking the output from our 100% Block 3 & 4 case from the article, we did a unit by unit analysis and identified the units that are no longer economically viable vs. the no CO2 case. This amounted to nearly 60 GW of generating units with almost 90% being coal – see map below. This is on top of the already planned retirements. In our base simulation, we have nearly 60 GW of coal plants retired from 2010 to 2016. Gas units are under economic pressure if the plant is located in a state with high carbon prices relative to the surrounding states. There will be gas plant casualties as a result of plant location as electricity flows do not know state boundaries.

We then retired those units and re-dispatched the system and went through the process as noted above to converge upon a CO2 rate that would meet EPA rate limits. This took almost 20 simulations given the need to also re-compute the retirement economics as we lowered carbon prices.
As expected CO2 prices do fall down relative to the previous results as coal units disappear from the system.

Reliability concerns are likely, but can be managed with transmission investments. These costs are not trivial and will show up in retail rates not wholesale prices. Retirements will be balanced by the large expansion of solar, wind, and energy efficiency programs and likely new gas generation from neighboring states. Wholesale power prices in this case are lower than in the previous case given the lower CO2 prices, but for Texas as 24% of the retirements came from there – see below.

Texas is expected to get a large dose of wind generation so the wholesale prices are likely to come down and potentially driving even more retirements – see below.

Obviously a crucial element was the outlook of the spread between gas and coal prices. Staying with the Fortnightly analysis we used the forward curve projections of 2016 in June 2014. Henry hub averaged $4.26 with CAPP coal prices at $65/ton. Both those benchmarks are much lower now – 25% lower for Henry and 20% for CAPP. Lower spreads likely means more coal retirements.
The next step of the analysis is to create a build profile to meet the requirements in Block 3 & 4 and re-disptach it within the system. This will have significant cost plus significant dispatch implications. One of the areas, we are reviewing is the large solar penetration in the west which will likely drive peak power prices negative in the shoulder months. All Energy Consulting can do this analysis, but we are looking for interested parties to fund this stage of the analysis. The result will be a comprehensive cost of the plan. In addition, we will be able to address some of the impacts of such large renewable penetration. Those interested in funding the analysis will get customized views of the results.
If you enjoy this type of analysis, please do consider supporting All Energy Consulting by contacting us for your energy consulting needs. We are able to offer these types of analysis because of the support we get from our clients. All Energy Consulting offers a pragmatic but enlightening approach to analyzing the energy markets. Our focus will always be for your success.
Your Enthused Energy Analyst,
David
Contact Information:
David K. Bellman
Founder/Principal
All Energy Consulting LLC
[email protected]
614-356-0484
Background David Bellman was the former Managing Director Strategic Planning at American Electric Power (AEP). He also worked as a consultant in Deloitte Consulting and Purvin & Gertz – now part of IHS. All Energy Consulting was formed in 2011 focused on energy analytics in order to add insights to the energy markets.
Case Study on Using Analytics to Save Money for Ratepayers
The origin of Power Market Analysis (PMA) was for power trading. However given my experience in all facets at one of the largest utility in N. America – American Electric Power – I knew the use of the knowledge of the power markets extended beyond enriching power traders. With the growth of deregulation and development of regional transmission organization (RTO), the power market has evolved as a legitimate option for power generation versus self-generation for utilities, municipals, Co-op, energy providers, and large consumers.
The power market is fascinating to me as compared to the stock market or other commodity markets as it offers a market that is pure. The power market has limited storage opportunities producing a fundamental convergence immediately not many months from now. The ability to manipulate the markets has situated from the rules of the market not the market itself.
Many utilities have only touch the surface of the power markets as they still largely depend on their own generation. This is changing as many baseload plants will be retiring over the next several years. In addition, dependence on renewable generation will lead to greater market reliance as intermittent issues are real. I have put together this case study to demonstrate and calculate a real dollar impact to the ratepayer if one can better account for the risk in the future market power prices. PMA cannot forecast the future in terms of weather, commodity prices, outages, etc… but it can let you know how much each of those variables can impact the market. This knowledge allows an informed decision on evaluating the option of using the future power market as part of your generation mix. In addition, this analysis gives you a firm and reasonable support for your decision making removing the stress from Monday morning quarterbacks. Many people understand there is much uncertainty in future events; however one should not leave decisions to chance or just assume futures markets represent reality – we can do better than a flip of a coin.
Please enjoy the case study and I look forward to your comments. CLICK HERE TO DOWNLOAD CASE STUDY – Case Study on Using Analytics to Save Money for Ratepayers – Beyond a Flip of a Coin
Your Energy Analyst Looking to Help You Succeed,
David
David K. Bellman
Founder/Principal
All Energy Consulting LLC- “Adding insights to the energy markets for your success.”
614-356-0484
[email protected]
@AECDKB
Renewable Cost Dropping – Impact to Resource Planning

A very good report on renewable cost is supplied by IRENA – Renewable Power Generation Costs in 2014. The absolute price numbers presented are hard to confirm, but the trends are likely undeniable. Most of the report is based on Levelized Cost of Electricity (LCOE). I have noted LCOE is not the best metric given the structure of the electricity market per my old article in 2012 (which, by the way, is the most popular page on my website for the last few months – not sure why, but it is). IRENA did note the issue with LCOE in their report.
The results from this report lead to implications that go beyond the obvious that renewable cost are coming down and potentially being very competitive with fossil generation. The first implication is the fact a report like this will lead to significant second guessing and planning work by resource planners.
Price discovery and the realities of renewable projects should be made transparent. IRENA report notes cost is very dependent on location. In states or local areas with renewable mandates with incentives, an open platform for project submissions should be created given ratepayer subsidies. Developers, ratepayers, utilities, and government officials should be able to access this site. I noted this in my article with my concerns to Senate Bill 310 in Ohio. There was an advance energy requirement in SB 221 which was removed per reasoning that there was a lack of projects under the guidelines of advance energy. My main concern with SB221 was the failure of the legislation to enable the commission to regulate and enforced the targets set forth. An enabler could have been budgeting and creating an open bidding platform promoted and managed by the state for advance energy projects. The platform would remove the concerns of pricing and the availability of advanced energy projects. This is beneficial to all parties. The utility removes the second guessing of the market place. Ratepayers and the commission know the project premiums and the depth of projects available. The cloak of the “evil” utilities preventing renewables will be removed with an open bid platform for advance energy. Cost produced from reports like IRENA will quickly be confirmed or denied. There is no need for commercial secrecy and competitive advantage when the ratepayer is willing to subsidize and potentially pay a premium.
The second implication from this report is to realize utility scale projects saves money. The report shows utility scale vs. residential PV produces a savings of over 50%. This savings not only comes in scale of projects, but by the utility cost of capital and other business intrinsic properties. Utilities should move into the PV space as Tucson Electric Power has done. There is no doubt a utility can drive more installation than a private company given the correct leadership and vision.
The third implication is the need to revisit biomass opportunities. Biomass generation’s ability to operate more closely to traditional resources offers significant operational advantages over wind and solar. The cost from this report indicate the premium for biomass is in line if not more favorable than many wind and solar projects. Many coal plants are making the conversion to gas. However given the trends and technology improvements in biomass a serious option to consider is the conversion from coal to biomass or even co-firing. The initial biomass projects in the US were a disaster in many cases. However, as with anything new, sometimes it takes a few failures to become a great success. The ratepayers should be equally willing to pay a premium for biomass as they do for solar and wind.
A final implication I will discuss is the subsidies applied to renewable generation. According to the IRENA report all their numbers represented cost without subsidies. Perhaps subsidies need to be removed from the most developed forms of renewables (e.g. wind) and the subsidies rolled down to other advanced energy forms. Advanced energy initiatives can be consider as insurance to the unknown of the future. As a society, we should be able to realize paying an insurance premium at a certain level is reasonable. Legislatures and commissions need to work to establish that reasonable level. Progress from anything new will come with some failures, but we must learn from these failures and move forward. The trend in falling prices from renewables was stimulated from government mandates. As generally a libertarian, this claim is hard for me to make, but being a realistic libertarian one realizes the system is not free to begin with therefore ideal principles cannot always work in an unideal environment. Utilities in their design are quasi-governments with limited competition. Stimulating the renewable investments from government mandates were likely necessary to achieve the fall in prices being observed. Much credit still must be given to the market players who took advantage of the mandates and delivered the cost improvements. It is my hope that at some point the subsidies and mandates will not be needed and we will have the capability to remove them. History is not our friend on subsidy removal. The agriculture industry still sees subsidies developed from the great depression. Even though our economy has shifted from agriculture, we continue with huge subsidies for farms no longer owned by families, but large corporations. Common in today’s political climate, we accept corporate welfare much easier than we accept social welfare. The reason for this is likely the effective capability of recycling corporate welfare dollars to the political process. I guess corporations are people to – right (Citizens United vs. Federal Election Commission)?
All Energy Consulting examines all the areas involved in energy and works hard to be open minded to the changing landscape. Please do consider us for your consulting needs as we are here for your success and have a proven track record of successfully identifying the paradigm shifts.
Your Continually Advancing Energy Analyst,
David
David K. Bellman
Founder/Principal
All Energy Consulting LLC- “Adding insights to the energy markets for your success.”
614-356-0484
[email protected]
@AECDKB
Oil price drop impacts beyond the obvious – Part 1

I am analyzing many areas as a result of the oil price drop. There are a ton of discussions of oil price drop and the impact it will have on oil production and economy. However there are impacts at the secondary level which can have billions of dollars of impact on the market.
The oil market drop will impact the Renewable Fuel Standard (RFS). EPA suspiciously delayed the release of the Renewable Volume Obligations (RVO) for 2014 twice. With the latest oil price drop, I suspect they will have support for revising and recalculating gasoline demand expectations, which will then thwart any attempts to modify the RFS. Most of the support for revising the RFS requirements was due to falling US gasoline demand and the theoretical limit of the amount of ethanol allowed in the market – aka “blend wall”. This is based on gasoline with greater than 10% ethanol will impact the mechanical aspect of the existing auto fleet. I will not argue the point surrounding this and save that discussion for another time. Given this conclusion, I do anticipate you will see renewable identification number (RIN) prices move up once they do finalize the 2014 and 2015 volumes in the spring.
What are RIN?
For those not involved in the power markets, you will be slightly lost. For those who have gone through the trials and tribulations of the Clean Air Act (CAA) and the emissions markets the government created in order to create an “optimal” path to emissions reductions – it is very similar. Very similar to SO2 and NOx markets, the government assigns a target of volume and produces a certification for each unit of volume. The only difference this time is rather than wanting the volume to be reduced, they want the volumes to grow. Instead of assigning an emission credit, they assign a production credit. As a producer of gasoline or diesel, you are required to obtain a set amount of RIN for each volume produced. One can do this by physical blending and/or purchasing a RIN. Another difference is instead of assigning a multi-year level of commitment ahead of time as they did in the CAA, the EPA is supposed to assign it each year in the spring. The market does have a general idea given the RFS does state targets, but as a fuel producer you don’t know your specific requirements. The brilliance of this design, and at the same time the most confusing, is the banking system which is very similar to the CAA construct.
The RFS includes the magical banking system. They have learned from the initial CAA markets and have adopted the banking restriction similar to the NOx markets, but actually slightly easier to follow as they limited the banking system to 20% of the total RVO for each year. There is no decline in values on vintage basis. The vintages from each bank can be carried into future years. The banking system is the greatest invention since slice bread for those into Operations Research and Game Theory – my two favorite subjects. I have spent much time in the analysis of emissions banking and game theory, and I presented to AEP management the relationship between the CAA emission markets and the Nash Equilibriums which can be generated. Funny enough Dr. Nash grew up near one of AEP power plants, which I believed is pictured in the movie – Brilliant Mind. There are fixed outcomes for these types of systems. They are equilibrium points when all market participants achieve a certain goal.
I was the lead proponent in AEP to sell the emissions credit heading into the newly created NOx market in 2005. The NOx market once introduced and, upon an extreme winter, decided to go crazy. The prices of NOx went over $5500/ton. This far exceeded any of the equilibrium points. The other nuance you need to realize in markets which turn in a credit on a fixed date is the cost of a credit in a given time is somewhat irrelevant since the only real value of a credit is when you turn it in. If you want to make money on a system like this you had better spend time on the end market vs. what the market is now. Starting the NOX season with a huge rise in price was pointless, and one could run 50+ simulations and show even the hottest summer could not generate a demand level of NOX that would necessitate the price above the highest market equilibrium point. In the end, after a few years, the market achieved one of the lowest equilibrium points – variable cost of running the control equipment.
The other unique aspect of the RFS is the three levels of targets – Conventional, Biodiesel, and Advance. In theory, and so far in practice, this is the order of greater complexity and cost. The order also represents the highest volume targets to the lowest. The rules do allow one to use a credit from the more complex target into the simpler target not vice versa e.g. Biodiesel RIN can be used for Conventional RIN.
RIN Future
With the lower oil prices and the market structure with banking, I don’t see how one anticipates the modification of RFS with lower goals. The main argument of “blend wall” will succumb to greater oil demand as consumers not only drive more, but consume more. The US will not likely save more given the design of our system and culture. The very act of consuming more whether food or services increases petroleum demand. The banking ability of 20% gives much room to buffer the changing weather from crop issues to the changing economy from driving.
The low oil prices will impact the economics of many ethanol plants, particularly those that have not been built. On a sunk cost analysis, the economics should allow them to continue to produce ethanol. This situation only leads to even greater value for RIN. The trading and risk mitigation of RIN need serious consideration for those producing transportation petroleum for the US or for those making the RIN. At All Energy Consulting, we can take our knowledge in the emissions and petroleum market to help you weather the storms of the RIN market.
Other topics to come due to the drop in crude oil prices – Condensate Value …Octane Value…..
Your Energy Analyst Thinking Beyond the Obvious for Your Success,
David
David K. Bellman
Founder/Principal
All Energy Consulting LLC- “Adding insights to the energy markets for your success.”
614-356-0484
[email protected]
@AECDKB
Whitepaper – Key Pieces to Modeling Power Effectively

As noted in the beginning of the year for 2015, we will work on producing a clear message to our readers, clients, and prospective clients about our commitments and value proposition. We are committed to adding insights to energy markets for your success – today and for years to come.
As part of the commitment, we begin with knowledge sharing by introducing a whitepaper on power modeling. Understanding the key pieces of modeling power will allow you to begin your endeavor in this challenging but very rewarding effort. This whitepaper will outline the areas of focus and also make a few high level points. We hope this will help you in your efforts, and as always, we hope you consider All Energy Consulting as an option for assisting in implementation or potentially using our PMA platform as an introduction into your power modeling efforts.
Please Click Here to Download the Whitepaper – Key Pieces to Modeling Power Effectively
AEC realizes you have many options in the markets when it comes to energy consultants. I want to state now – no other consulting company will be more committed to sharing knowledge – not just information – for your success than All Energy Consulting. We are not hesitant to empower you and your team to the point where our consulting role may be limited in the future – we treat this as a success.
Your Very Willing to Share Energy Analyst,
David
David K. Bellman
Founder/Principal
All Energy Consulting LLC- “Adding insights to the energy markets for your success.”
614-356-0484
[email protected]
@AECDKB
