Another 30% return in Month Time? – Next Trade De Jour
It will be hard to beat my BEST winter trade call for buying the Dec. 2014 AD-HUB minus NYJ spread – As of 11/24/14 close, the spread moved to -$31/MWh vs. when we wrote about it at -$44/MWh – up 30% since October 9th 2014. I hope all of you took my advice when you read about it.
Likely my last and final timely free call to you (in this case the release was delayed only a few days -some received an early release of the analysis ahead of time) will be to sell the January Ercot North On-Peak Heat Rate (ERCOT North On-Peak / Henry Hub) and to once again take a look at buying the AD-HUB minus NYJ Spread this time in March 2015. As previously discussed, the process to identify these trades was to use the built in screeners from PMA-NT default runs. Then, a complete analysis was applied to stress test these trades, both from a future and historical perspective, as described in my previous article.
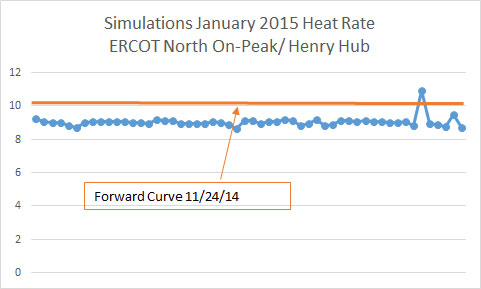
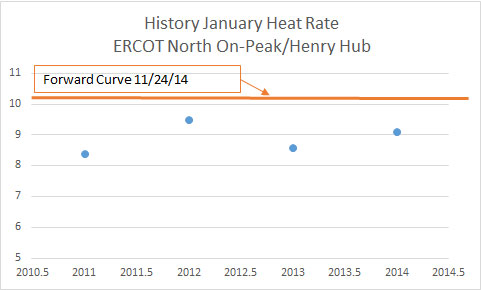
The ERCOT North Heat Rate sell is based on over 50 simulations plus a historical perspective. This is not going to be a huge money maker but the risk of loss is minimal. The current forward curve is showing a 10.11 mmbtu/ MW heat rate. In the last 4 years, the highest heat rate achieved was 9.54 in January 2012 and the lowest was 8.4 January 2011. Based on over 50+ simulations, the average heat rate was 9 with only 1 simulation greater than 10 at 10.5. I feel very comfortable with this trade.
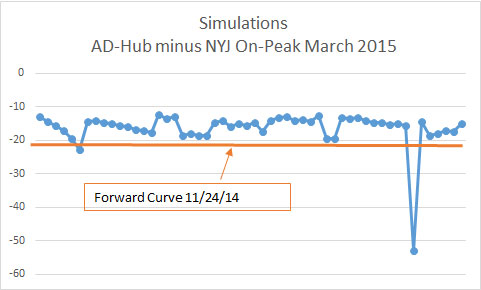
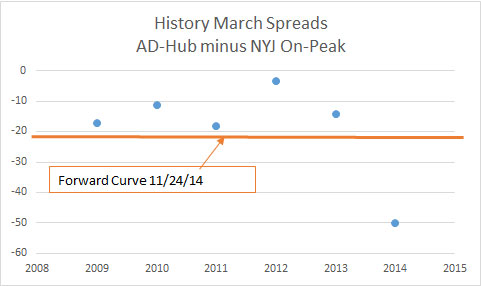
The AD-Hub minus NYJ On-peak spread has treated us very well this winter. Examining the March 2015 spread, we see the same opportunities. Currently, the spread is trading at -$23/MWh. Unlike our past call, there is more risk in this trade. There is 1 simulation – the weather profile of 2013-2014 – which produces a -$52/MWh trade. This compares with the historical actuals of 2014 March of -$51/MWh (Nice Calibration!). Outside last year, from 2009-2013, the March spread has averaged -$13/MWh. The 50+ simulations produced an average of -$16/MWh (which includes the one simulation that was more negative than $25/MWh). This is a great trade if you feel comfortable with the weather risk. In our slew of simulations we did run the weather for the past 12 years with only 1 year indicating a loss for this trade.
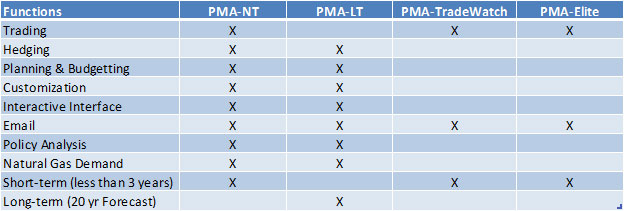
I will release a new publication product – PMA-TradeWatch. PMA-TradeWatch will screen out trades based on the default setup of PMA with a layer of historical screening. These trades will represent the first layer (identification) of trades to look into. A file will be sent daily to subscribers. As I noted in my process in finding the BEST winter trade, it takes more work than the initial screen to really prove this to be a trade to place your money on. PMA-TradeWatch is a report to indicate to you potential trades. With this list it will narrow the amount of investigation. Ultimately I would recommend running more simulations and applying more historical analysis. Following this process will lead to successful trades similar to my best winter trade. We could facilitate the process for additional simulation and analysis for an additional fee. However, at some point, it would be more cost effective to do PMA-NT.
We may release another product PMA-Elite which goes above and beyond PMA-TradeWatch and goes through the process and does the work to give these winning trades. PMA-TradeWatch is an ideal augmentation for those who already are staffed with a full team of analyst. They can shoot holes and discover the winning trades from the list supplied by PMA-TradeWatch. PMA-Elite is designed for traders needing the complete analytical solution to finding money making power trades. Both PMA-TradeWatch and PMA-Elite are focused on trading. Our other products are designed for greater breadth of usage – see below table for summary.
We hope that all our articles have proven the success and efficacy of our Power Market Analysis platform (Summer Trading, Summer Hedging, Winter Trading). Please do consider All Energy Consulting for your analytical needs in the power spectrum. All fuels ultimately lead to power. Building up the energy foundation from power makes sure all things are tied together.
I hope you had a wonderful Thanksgiving. Thank you so much for all of your support.
Your VERY Thankful Need to Exercise Energy Consultant,
David
David K. Bellman
All Energy Consulting LLC- “Independent analysis and opinions without a bias.”
614-356-0484
[email protected]
@AECDKB
blog: https://allenergyconsulting.com/blog/category/market-insights/
Ethane Favored Status – another convergence to power
I have had many responses to my previous article Splitting the Profit – Condensate Splitter Under Pressure. Let me clarify some of my points and highlight some valid feedback.
US ethylene production is mainly from ethane, whereas the rest of the world is Naphtha. However, the point I was trying to extend is the rest of the world may very well also move to more ethane, as I believe ethane exports are viable via ships that carry ethylene – see below. This puts more pressure on Naphtha pricing as the rest of the world can eventually shift to ethane if Naphtha pricing is not in balance with ethane. In addition, given the expansion of ethane crackers in the US, this may very well put pressure on ethylene cracking margins which then translates to feedstock such as Naphtha.
In summary, my main concern being expressed in the original article are those investing in condensate splitters, in hopes of mitigating the condensate discount, may just be shifting their concerns to Naphtha discounts. As noted previously I believe there is room for condensate refineries. I have been working on one that just needs funding. As with many things, in order to make money you need money. This is a refurbishment for an existing condensate refinery with a cost range between $400-600 million. I can supply more information just send me an email [email protected].
I certainly was not trying to completely solve the ethane issues in the previous article. There is no doubt ethane problems are real and will be very challenging, particularly the next few years as many projects are still in permitting phase. Based on the available information, I believe exporting ethane is the way to balance the market in the meantime. As noted above, one could use ethylene carriers to transport ethane. Ethane can potentially be the “bridge” fuel for locations requiring power, but without the required scale of LNG. There are several engine manufacturers working to be able to use higher and higher content of ethane. Ethane use for power generation can easily be converted to LNG when the required scale is reached. In the meantime, regions burning oil (many outside US) can look to this economical and viable alternative to oil. With ethane flexibility to be used in petrochemical and power generation, ethane may actually end up being a favorite child from a step child as I alluded to in the first article.
All fuels ultimately lead to power. Building up the energy foundation from power makes sure all things are tied together. Many consulting companies are driven from the Oil & Gas side of the analysis as more revenue comes from those industries, but at All Energy Consulting we are driven through intellectual integrity. We report to no shareholders and have no targeted mandates.
We wish you a Happy and Safe Thanksgiving. Thank you so much for all of your support.
Your VERY Thankful Full Spectrum Energy Consultant,
David
David K. Bellman
All Energy Consulting LLC- “Independent analysis and opinions without a bias.”
614-356-0484
[email protected]
@AECDKB
blog: https://allenergyconsulting.com/blog/category/market-insights/
Sign Up to AEC Free Energy Market Insights Newsletter
“Pull a thread here and you’ll find it’s attached to the rest of the world.”
Nadeem Aslam, The Wasted Vigil
Splitting the Profit – Condensate Splitters Under Pressure
As I noted in the Condensate Economics Explained this summer, condensate splitters will not be a sustainable solution to the condensate flood in the US by itself. The recent article by RBN indirectly supports this claim. RBN expects very high natural gas liquids (NGL) production. The problem child in NGL is ethane. Ethane, because of its unique property relative to propane, butane, and pentanes plus, requires much more effort to liquefy. Therefore, often ethane is left in the gas stream (rejected) versus extracting and supplying it to the petchem industry. However, only so much ethane can be left in the dry gas stream before it would fail to meet pipeline specifications.
With ethane falling to the lowest level ratio in decades to natural gas, there is a large incentive to go ahead and leave as much as one can in the dry gas stream. As also noted by RBN, there is just so much NGL that ethane will easily exceed the current demand levels leaving prices to likely free fall in certain regions. This will result in petchem plant demand which brings us back to Condensate splitters. The yield of condensate splitters is mainly Naphtha. Naphtha is used by many petchem plants. There exist many chemical plants which can take multiple feedstocks to produce the same product. The driving products of the petchem industry are known as Olefins (CnH2n) – a hydrocarbon with one double bond carbon and single bonds elsewhere – aka Alkenes (sorry about being so nerdy, but sometimes you just have to be technical to really understand it all – I also need to use my Chemical Engineering Degree every now and then). These Olefins include the more recognized names of ethylene, propylene, and butylene. The process of taking the feedstock and converting the product is typically called cracking. The reason for this is because you are breaking the molecular bonds and producing a new combination which constitutes your product.
Historically speaking Naphtha is the dominant feedstock for world production of olefins. For ethylene production Naphtha represents almost 50% of the primary feedstock. However the use of ethane to make ethylene is rapidly growing. Hopefully by now you are starting to see the convergence of Condensate Splitter and Ethane. Even if a petchem plant is designed for a certain feedstock – all it takes is some capital to be able to process other feedstock. Those who built US condensate splitter hopefully did their economics based on significant market competition with ethane.
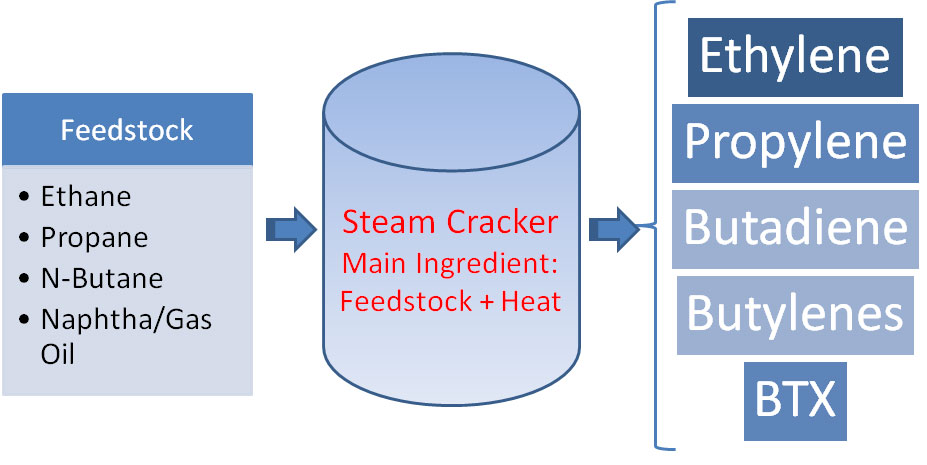
Petchem plants are essentially a simplified refinery. Compared to trying to model refineries, petchem modeling is much simpler. The feedstock is typically already cleaned out and the process can be placed in one block versus multiple conversion equipment in refining – see Figure below.
Cracking a certain feedstock will result in varying yields of product – similar to processing crude oil in refineries. There is a value point where one feedstock will be more profitable than another. A complete gross margin can be computed for the varying types of crackers. Gross Margin at a Petchem plant = Product Prices x Yields – Variable Cost – Cash Cost – Fixed Cost. Similar to a refinery each of these components will be different depending on your feedstock.
Potentially All Energy Consulting will release another product Chemical Market Analysis (CMA) where, on a daily basis, a computed value of the various cracking modes (ethane, propane, butane, natural gasoline, and Naphtha) is computed based on future markets. We are close on our Oil Market Analysis (OMA) product release. Both these platforms will enable the user to input their own future expectations of price and a computed value will be calculated. We have the models and the platform and are just looking to finalize our data provider. Please email me if you are interested in either of these products. If you have your own forecast data, we can deliver this to you right now.
Your Split in Many Ways Energy Analyst,
David
David K. Bellman
All Energy Consulting LLC- “Independent analysis and opinions without a bias.”
614-356-0484
[email protected]
@AECDKB
blog: https://allenergyconsulting.com/blog/category/market-insights/
Sign Up to AEC Free Energy Market Insights Newsletter
“Pull a thread here and you’ll find it’s attached to the rest of the world.”
? Nadeem Aslam, The Wasted Vigil
Producing a Clean Hedge that is Defensible
Hedging can really be a gamble if not done right. The latest news from OW Bunker A/S highlights some of the concerns from hedging. The stock has fallen 60% largely as a result of uncertainty in the hedge taken by the company. In this case, it may very well been a clean hedge that was poorly timed (failure of analytics) or it was a “dirty” hedge which constituted a gamble in the market place. Either way the Chief Risk Officer has been fired.
I demonstrated last time in Effective Power Hedging that PMA can be used as an analytical tool to develop a systematic hedging program. I want to highlight the value of PMA as a career saving tool (AKA: cover your a** (CYA) tool) PMA can be customized to store and run every day. All the analytical background for decision making can be pulled up. I am sure management at OW Bunker A/S wish they had simulations at least demonstrating the risk/reward they saw when they made the hedge. With PMA, series of simulations can be pulled to justify the transaction. In addition, the Risk Officer would have liked the simulation to be developed from a third-party stand point. PMA does offer customization, but the backbone and secret sauce is the extensive work in calibrating the model to emulate the market prices and fuel consumption. You can throw the kitchen sink at PMA and it will return the appropriate value given the inputs into the model. PMA can be customized, but can be still considered external to your organization.
A failure of identifying the risk reward profile appropriately would come from your simulation lacking enough uncertainty. One can use PMA to backcast to “prove” the simulation supported an appropriate range of uncertainty. For those looking to manage and perform hedging in power I am strongly suggesting you reach out to me to show how PMA can potentially save your career. Not only do we have the tools to help you, but we have the experience and knowledge. In many cases, not hedging commodities that offer liquidity can be constituted as much gambling as a person who trades for profit. You can always be second guessed for your decisions. All Energy Consulting can give you support for your decisions or indecisions.
Note on your calendar, I will be speaking at an event in Dec 10-11 on Solving Commodity Risk Exposures for the power industry. * POSTPONED TO FEB 15 The event is focused on Energy and Commodity trading. I look forward to seeing many of you there.
Your CYA Energy Analyst,
David
David K. Bellman
All Energy Consulting LLC- “Independent analysis and opinions without a bias.”
614-356-0484
[email protected]
@AECDKB
blog: https://allenergyconsulting.com/blog/category/market-insights/
Sign Up to AEC Free Energy Market Insights Newsletter
Crude Oil Markets Are Not Like 1998
I have been giving a presentation on the future of the oil markets to various people. I am working on converting the presentation to paper. So far, all have appreciated my unique and refreshing insights to the oil markets. I would post my presentation material, but like most of my presentation materials, it is not designed to be a stand-alone document.
In order to find the future price of oil, we need to understand how the market got to where it is now. The presentation starts off with the fundamental question – IF you had forecasted the following fundamental parameters relative to the actual results, where would your price forecast relative to actual results be?
-
World oil demand forecasted too high by 10 million bpd
-
US oil demand forecasted too high by 5 million bpd
-
US crude oil imports forecasted too high by 10 million bpd
-
OPEC world oil supply represented 15% less than anticipated
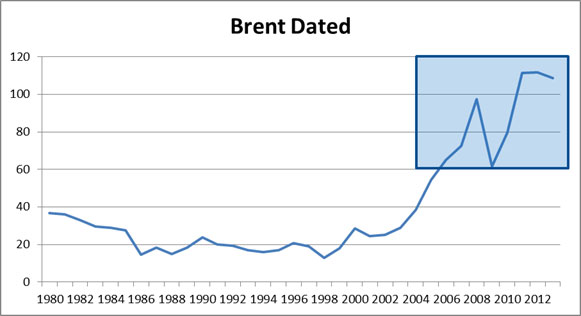
Most rational energy analysts would suggest the price forecast would have been too high given these factors. However, this is far from reality. In 2013, the average price of Brent was $111/bbl. The EIA Annual Energy Outlook in 2002 high price outlook forecasted $40/bbl. All other analyst, including myself, would have been ridiculed to show prices above $50/bbl for 2013 – (less than 10 years out). Four years later in 2006, there was only a slight improvement in the forecast. The EIA high case now showed $80/bbl for 2013. At the time, I had forecast subscriptions from PIRA, CERA, and WoodMac. None of them had a forecast for 2013 – less than a decade out – remotely close to the actualization of $111/bbl other than CERA extreme scenarios with a range of $110-$30/bbl (any use when the range is that wide?).
I hate being wrong and vehemently detest being wrong without knowing why. It would seem the market has conveniently reset their forecast and have accepted this new price paradigm without really finding some fundamental rational to this new price level. Many will bring up geopolitical risk and supply disruptions – but all the supply disruptions would not amount to being wrong by 10 million bpd. Then the next excuse is cost of production being higher. I think this is more a symptom rather than a cause for being too low in the forecast. Another reason mentioned is increase trading in oil, but once I again I feel it to be a symptom not a root cause.
In my presentation and my future paper, I delve into the reasons used to rationalize how we got where we are. On a high level, the reasons investigated beyond the typical fundamental supply/demand country analysis are Monetary Policy and the shift in the demand elasticity curve. Finally, I will also address why this is not 1998 for which I have first-hand experience given my 15 minutes of fame was all used up that year (Front Page USA Today and other). Please contact me if you are interested in me presenting to your team this unique and refreshing view on the oil markets from a pundit who was in the trenches in 1998 and made the call for the collapse.
Your Used All My Fame Energy Analyst,
David
David K. Bellman
All Energy Consulting LLC- “Independent analysis and opinions without a bias.”
614-356-0484
[email protected]
@AECDKB
blog: https://allenergyconsulting.com/blog/category/market-insights/
Sign Up to AEC Free Energy Market Insights Newsletter
“In the future, everyone will be world-famous for 15 minutes” Andy Warhol
Finding Winning Power Trades – The Process
Many people have asked me to further explain the process of coming up with my recommend best winter trade posted on October 9th, 2014 which on 10/28/2014 was up over 20% in less than a month. Obviously the root of finding the trade was to use Power Market Analysis Near Term (PMA-NT). As I have noted many times PMA-NT is more of a service than a product. The default setup is still very useful without any customization, which I will demonstrate here. PMA-NT default is based on the forward curve. In this setup, the arbitrage being found are the disconnects between gas futures and power futures. In essence, gas futures get lost in translation converting to power futures due to the moving parts in the power sector. PMA-NT can help find those translation errors. PMA-NT can also be fed your fundamental outlook of natural gas markets to find those disconnects.
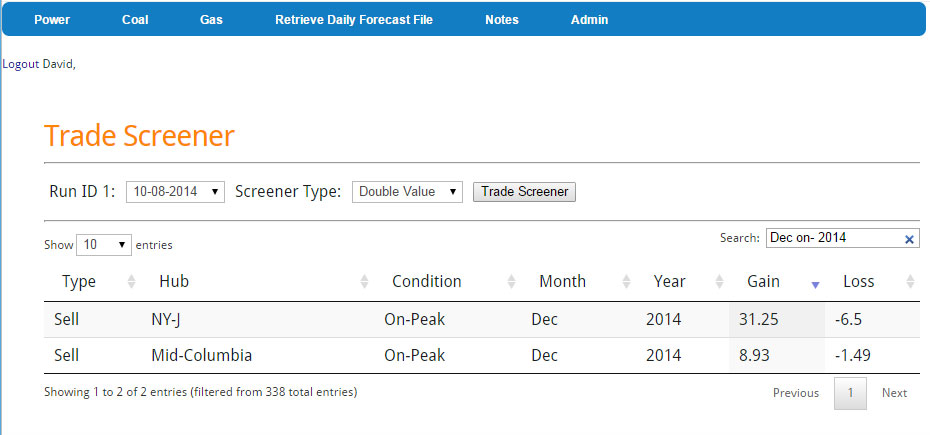
Part of PMA-NT includes some very advance and powerful trading tools. There are about 650 trading opportunities calculated in the default PMA-NT within in just 1 case (more can be added). The PMA-NT default runs five potential scenarios of the future. In order to find out my best winter trade I used a new customizable trade screener tool called Double Value versus One Sided Screener. Double value screens out all the trades with at least a double value relative to the potential loss. This list quickly reduces the 650 trading options. Given I wanted a winter trade and something that didn’t hold the risk of the Vermont Yankee nuclear retirement I filtered the results for Dec 2014 Winter. I also wanted a liquid contract so I filtered for On-Peak. Then finally I sorted by Max gain. All this occurred on one page in less than a few key strokes – screenshot below.
In the five cases simulated on 10-08-2014, the results show two trades that qualify on the logic that I wanted On-Peak trades in Dec 2014 that would have the potential to gain more than twice the loss potential. Out of the five outlooks simulated by PMA, there was a case that showed a potential gain of $31.25/MWh if one sold the NY-J On-Peak Dec 2014 contract. Inversely there was a case that would show a loss of $6.5/MWh. The default 5 cases involved moving the Henry Hub prices and altering weather impacts. These cases can be customized for your region of interest. Further descriptions of the default cases are available.
Now that I have identified a trade of interest I didn’t just stop there. As noted in the previous article I am risk adverse and would like a way to mitigate against tail-events such as pipeline explosions to other unforeseen extreme events. In order to mitigate the risk I usually use a spread or heat rate play. In addition, 5 cases are not enough for me to put on a trade – good enough to identify a trade. The good news is I also had run a Winter Outlook. The winter outlook included 54 more cases to examine. It was clear to me the NY-J power forward price was being impacted from last year’s polar vortex. This risk is a potential reality, but it would seem to be less of a probability. However because of my risk adverse nature, I wanted to find a price hub that was not taking into account the polar vortex as much as NY-J. Therefore if a polar vortex would occur to the level seen last winter I could be covered somewhat. Out of my 54 winter cases included running last year’s weather outlook, but without all the extreme outages. Base on that simulation it shows the AD-Hub having some room to run up with a polar vortex relative to the forward curve and relative to NY-J. The NY-J contracts seems to be limited as the “fear” premium is already in play.
Besides all these simulations I also did a walk back in history. There are many questions that needed to be understood. Polar Vortex last year was not really a January impact , how cold has it gotten in December and where did AD-Hub – NY-J spread moved to? As I noted in the previous article – From 2010 to 2013 December spread between AD-HUB minus NY-J went as wide as $-39/MWh in 2010. With the spread at $44/MWh I felt comfortable going with this trade as the best winter power trade.
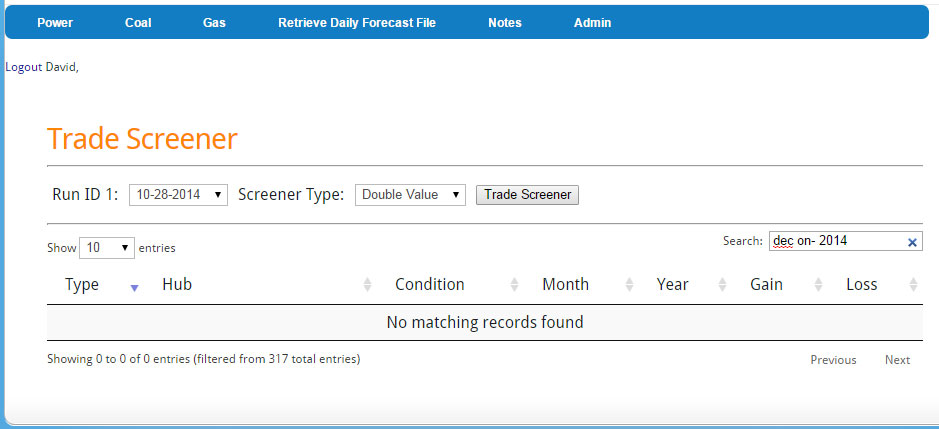
Given the market changes in less than a month, it is a good thing PMA-NT is designed to run daily. The exact screener on 10-28-2014 shows no trade opportunities in the Double Value category. The AD-HUB minus NY-J spread likely should be closed given the 20% return – per my risk averse nature. I am sure there are other traders who can stomach the swings better than me – looking for an aggressive trading partner to work together to create a perfect balance.
At All Energy Consulting we understand supplying you with forecasts is only one step of the process and may even be the smallest value of the process. The real value comes from the interaction with us and the willingness to explain the process and have frank discussions on the results. We believe no other consulting product will offer this unparalleled experience. You will work directly with me, an experienced analyst from one of the top energy consulting company (Purvin & Gertz / now IHS, Deloitte) and one of the largest utilities in the industry (American Electric Power (AEP)). PMA-NT is not just a product, but more of a service. We want to work with you in understanding the volatile power markets.
This also applies to our long-term service PMA-LT. We can work with you to understand the impacts of various policies and develop a cohesive resource plan.
Please contact us at your earliest convenience. We look forward to beginning the conversation.
Your Willing to Work with You Energy Consultant,
David
David K. Bellman
All Energy Consulting LLC- “Independent analysis and opinions without a bias.”
614-356-0484
[email protected]
@AECDKB
blog: https://allenergyconsulting.com/blog/category/market-insights/
Sign Up to AEC Free Energy Market Insights Newsletter

