EIA Annual Energy Outlook AEO 2012 Points of Interest
Each year when the EIA releases their Annual Energy Outlook AEO, there is much talk about the results. The problem I find each year is trying to understand the change in the relationships between various markets. This is a function of the underlying model they are using. They are using the NEMS model which uses a general equilibrium concept. Personally, I never felt modeling should be left to the model. General equilibrium models are very dependent on all the experts to enter the relationships. Then the model will model those relationships. However, if you don’t have an expert of all things, the model may produce interesting relationship changes; since these experts are experts without integration.
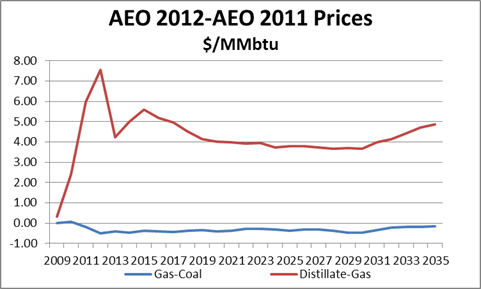
My quick review focused on the Natural Gas, Coal, and Distillate: This is largely because the power market comingles these fuels, therefore, these relationships should be acted upon by the power market. Below are the gas price comparisons to coal and distillate deltas to the 2011 AEO deltas.
AEO 2012 decided in this year’s outlook that the oil spread to gas will be larger than last years by over $5/MMbtu. The gas to coal spread will decline by $0.30/MMbtu. This is largely a result of coal prices being stronger than gas prices being weaker.
Given these relationships before examining the consumption numbers, I would believe that more gas will be in the power sector. Coal use should decline. There should be some gas to liquids (GTL) at some point given the large economic incentive.
The consumptions on a high level show coal consumption being 10% less – no surprise there. However, total gas consumption is essentially the same as last year’s AEO 2011. Digging deeper the power sector use of natural gas climbs over 12% from last year’s AEO. Where is the demand for gas falling to keep the totals the same? It would seem the EIA has a more bearish outlook for natural gas use in the industrial sector and commercial sector. The commercial sector falls 7% which perhaps can be accounted for by efficiency improvements. Industrials seem counter intuitive given the many chemical projects recently announced.
Coal to liquids (CTL) demand fell by half, directionally correct since coal prices are higher but certainly not to the degree that liquid prices are higher. Interesting to see no gas to liquid (GTL) demand. I understand the complexity of GTL (I have a BS Chemical Engineering degree from the University of Texas). Numerous reports suggest GTL likely many years out. However all those reports were written when gas and oil were much closer to parity in the United States.
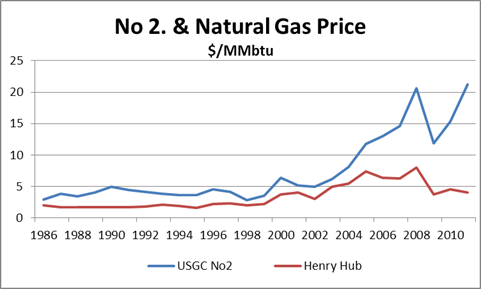
In addition, the driver for GTL was for stranded gas not in the US. The US innovative market structure plus the sustained large spread between gas and oil should lead to GTL development. My skepticism in GTL lies in the premise the spread will be that large for such a sustained time period. Based on my assessment, the amount of natural gas usage in the power sector is still too low by around 20%. It would be hard press to maintain the coal fleet as it ages with gas prices below $5/MMbtu for the next 10 years. In terms of balancing capital and environmental risk, no other form of generation can beat natural gas for baseload demand across the country. New coal units cannot compete with new natural gas plants with gas-coal spreads less than $3/MMbtu. Around $3/MMbtu, it is marginable and when considering the CO2 risk, it would take spreads closer $4/MMbtu+. Commissions approving coal plants in this environment are typically incorporating other unrelated energy economics (e.g. local jobs, resources). The only thing that haunts natural gas is the price spike seen in 2005-2008. However, if you think about the catalyst that drove that price rise, hurricane Katrina, it becomes less likely to vision in the future. Shale gas has created another layer of gas in the supply curve, which is less sensitive to gulf coast storms.
Further analysis of the AEO is warranted. A certain credit must be given to them for being the pundit willing to go out on the limb and supply every bit of information. I don’t usually agree with the EIA forecast, but they have made great strides in their forecasting ability. They have incorporated more reasonable capital cost projections. They are a good benchmark for modeling. We can only wish other countries around the world would emulate the EIA in supplying historical information and estimated forecast figures.
Market assessments and market forecasting are one of our specialties.
We positively and evocatively challenge the current thinking involving any aspect of energy use. We look for projects that offer meaningful, transformative, with impactful outcome to the marketplace or society (see projects).
Please consider All Energy Consulting for your consulting needs.
Your Energy Consultant,
Energy Efficiency Reports – A tale of two bias reports
Before I jump into this blog, I want to state some obvious statements. Energy is a means to an end. The use of energy typically increases the well-being of the individual. Being more energy efficient produces better productivity by freeing capital to be used elsewhere. No one strives to be wasteful, but the law of entropy requires work for us to be more efficient. We do have thresholds where our behavior (e.g. laziness) will change.
I came across this report/blog by the CO2 Scorecard supposedly debunking the numerous reports/articles not shining a very bright light on efficiency – in particular the Breakthrough Institute (BTI) report. I will say both reports did a fine job in highlighting various variables important in understanding the efficacy and impact of efficiency. The CO2 Scorecard tries to compare various micro topics with very broad BTI topic. At the same time the BTI did not stick to their broad topic of energy consumption by selecting individual cases such as lighting to demonstrate their concerns. Each alluded to Jevons Paradox, but did not follow the true principle/theme Jevons Paradox. Clearly Jevons noted resources. Electricity is not a direct resource, but a creation from resources, which is later used as a resource. It is the underlying resources which derive energy consumption – British Thermal Units (Btu). Saving in electricity does not necessarily conclude savings in resources and/or energy use, which I will show below. Changes in the use of electricity will have micro impacts which are lasting as the CO2 Scorecard noted on refrigeration, but this does not change the macro premise of increasing energy use as you become more efficient.
CO2 Scorecard certainly presented more graphs and supposed data supporting their thesis that efficiency by itself will reduce energy consumption. I will disagree. Let me first state, I am not funded for this analysis, therefore I can only delve so much into this – though if someone would like to fund me I would be glad to be more thorough – but I believe the charts and the data I have put together should bring some doubt to the CO2 Scorecard claims. First I will address my greatest pet peeve from the champions of efficiency – using California as the example for the rest of the country. There is a reason California is the most populated state and it’s not because of the local government, taxes, and friendly people – it’s the weather in concert with its natural beauties (beaches, forest, etc…). The term Sunny California is not even close to the saying Sunny Texas. Overall the winters are mild compared to Ohio and the summers are mild compared to Texas. The primal use of energy is for climate control from the extremes and for cooking. With California not observing any extreme temperatures, it should be no surprise; they are the least energy intensive state.
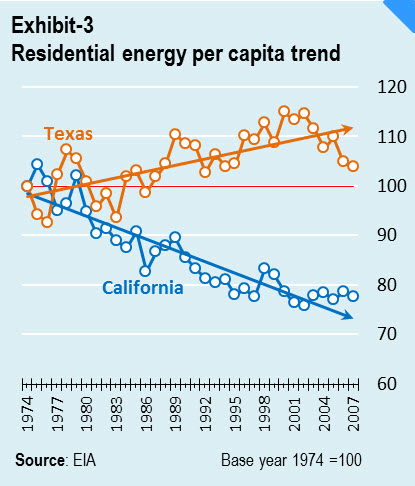
CO2 Scorecard shows the following graph in their report to support their claim that efficiency programs can have significant impact on energy use. Once again, I will agree that efficiency program can have micro impacts by themselves, but do not have significant sustainability for a macro reduction of energy without other factors such as price.
Let me present some charts that the CO2 Scorecard folks could have easily added into their analysis, if they truly wanted to be empirical.
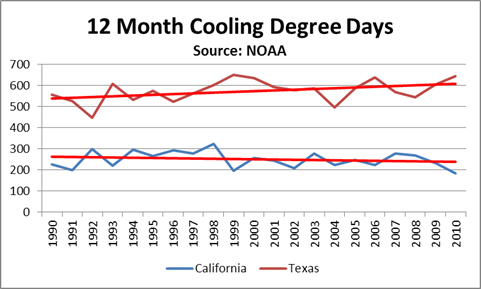
Cooling degree days represents the days above 65 degrees Fahrenheit. The data can be obtained from the National Oceanic Atmospheric Administration (NOAA) who manages the National Climatic Data Center. If you plan to use their data be aware of each of the drop downs and the meanings. The cooling degree chart actually does show a warming trend for Texas for the last twenty years, whereas California has been showing a cooling trend. This is skewing the chart CO2 Scorecard presented. Each Texan had to use more electricity to maintain the corresponding comfort from last year, whereas Californians improved their energy use as the weather only got better – life is unfair.
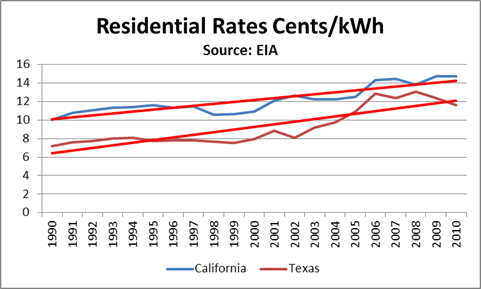
Another chart accessible to CO2 Scorecard, which they failed to delve into, is the Residential retail price trend. Price is the missing piece in many efficiency discussions. Real sustained energy reduction can be obtained with the combination of efficiency and price increases.
Texas was catching up to California, but this will not likely occur as natural gas prices have fallen. California’s sustained higher prices have resulted in greater incentives for Californians to save each kWh.
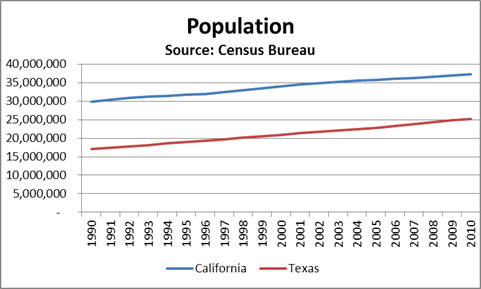
Population trend was also an important element in producing the digression in energy use per capita.
Texas was growing twice as fast as California for over the last 20 years. My northern friends set their summer thermostats between 68-72 whereas my Texas natives live with 78-80. Clearly a subset of the growing population in Texas was going to use more energy.
Micro vs. Macro and a Question of Morality
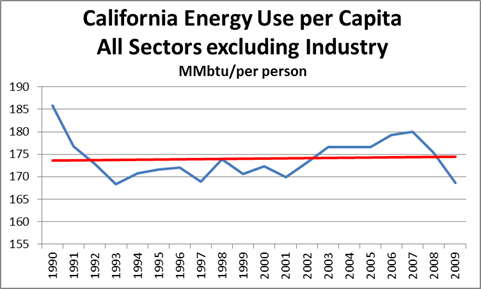
I think both the CO2 Scorecard and BTI mixed up micro elements with macro discussion of energy reduction. I will use the California case to prove my point. As Californian’s reduced their use in Electricity in the residential sector, this enabled the Californians to re-allocate their capital for more consumption elsewhere. This is the nature of our economy – consumerism. This can be seen in the form of driving more, shopping more, and/or living with more things. The chart below presents this to be true:
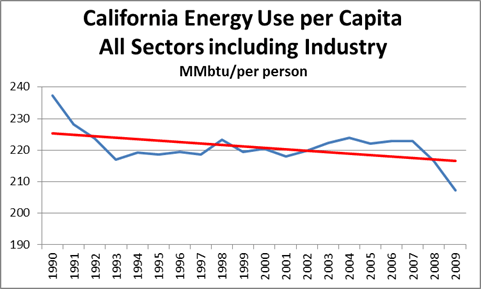
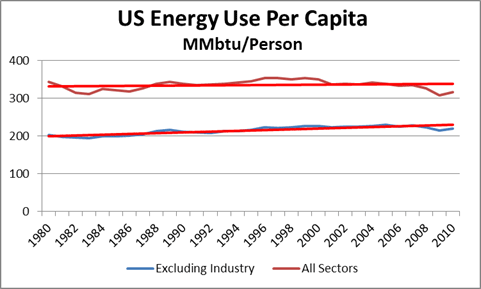
The positive note is the consumption trend line is quite flat, but this is likely due to the cost of living in California and the exporting of energy use (later discussed). I have excluded industrials because of the national and local trend to push manufacturing away. If I put it back into the chart, the amazing efficiency trends re-appear.
The efficiency trend with industrial is evidence of the micro vs. macro trend. Energy is a global demand as we each strive to live better. Resources making energy is in demand worldwide. If we use less, most likely others would benefit from our reduction in the demand pressure on that resource. At the same time, we cannot take credit for a reduction of energy when we have decided others to make our widgets and we only track the energy consumption of using the widgets versus the energy cost of making the widgets.
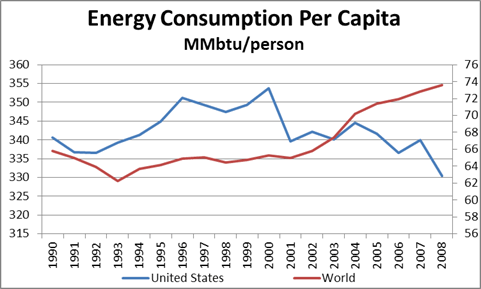
The above chart shows the manufacturing shift and also the electrification of people who have no access to electricity. For us in the western world it is almost impossible to imagine not having access to electricity. Yet, 1.4 billion people in the world still do not have electricity. This is 1 in 5 people in the world without electricity.
Even in a micro view of only the US, there is evidence the shift of California energy use was partially shifted to other states in the US.
The trend line in energy use is still climbing for both lines, less so with all sectors included. We are still increasing our energy even though we have become more efficient.
I see a large value in efficiency improvements, but it is not on the basis of reducing energy. It is on the basis of freeing capital to allow other forms of investment in matters not focused on the means, but the ends. We can see this has happened by what CO2 Scorecard emphasized, the falling use of energy for refrigeration in households. In fact, residential use of total electric consumption from refrigeration, space cooling, space heating, water heating, freezers, cooking, and indoor lighting now represents only half of the energy consumption as compared to 1980 when those categories represented 90% total residential electric consumption. Some of us now use more energy on our widgets than our essentials and our ability to do this can largely be attributed to several efficiency programs. On a moral basis, we have helped the rest of the world to more easily obtain the use and value of energy by being more energy efficient. It is almost a mass balance. We will use resources or someone else will, unless there are price drivers preventing the pursuit of living better.
Another moral question we need to balance locally, efficiency programs are regressive in nature. As an example, a subsidy from the utility to insulate housing must be paid for by the rate payers. A subsidy typically means a partial payment. Those who likely have free capital to spend – versus living paycheck to paycheck – are more affluent. The affluent will likely take advantage of the subsidy. The utility rates in the near term will rise from the subsidy itself and also the reduction of energy since the utility model is designed to recover cost. If the system uses less energy the utility must charge more per energy use to be whole. Those who do not take advantage of the subsidy will be impacted twice as much.
As with many issues in the energy industry, things are not black and white. However, if we maintain an open-mind to learn and change our views, we can learn to progress and make better decisions. I am open for criticism for my analysis. Given my time commitment and lack of funding, I certainly could have overlooked a few critical items. My point in writing this is not to produce a conclusive report on this subject, but to point out some critical elements I see missing in the various discussions on efficiency. This writing should not leave anyone to decide to be against efficiency, but to understand the value of efficiency and to help accurately color the discussion on the various efficiency programs.
If you like this type of analysis, please consider funding studies for me to do or hiring me as consultant.
We positively and evocatively challenge the current thinking involving any aspect of energy use. We look for projects that offer meaningful, transformative, with impactful outcome to the marketplace or society (see projects).
Please consider All Energy Consulting for your consulting needs.
Your Energy Consultant,
David K. Bellman [email protected] 614-356-0484
Heating Degree Days Show Winter Never Came
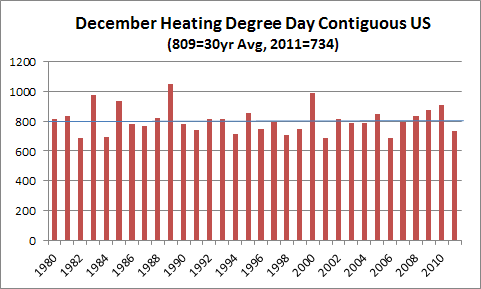
In my previous article on natural gas prices, I stated eventually gas prices were going to come back up. However, I carefully noted in the last sentence “when the winter weather comes”. Based on the data so far, winter is not coming. Below chart comes from the NOAA data showing the previous 30 years of December heating degree day (HDD). As you can see from the chart, December 2011 was warm compared to the last four years. It is almost a whole standard deviation from the average.
Looking at the weekly January HDD, January is trending even lower from normal weather. This natural gas price capitulation could get much worse before it gets better; as the natural gas must be withdrawn in several areas else damage to the aquifers can occur. There are contractual agreements requiring withdrawal of gas by the end of the heating season.
Once again it shows the most important variable to understand is DEMAND – which in this case is driven primarily by weather. This statement is certainly true in power. One can have all the knowledge in market relationships, but if your demand is off all bets are off.
In the longer run (6months+), gas at this price will put significant pressure on the utilities to curtail/retire their marginal coal plants. As natural gas price falls, more coal plants are considered marginal. I suspect some coal plants are running regardless of economics as the operator probably has contracted too much coal. In this case, one would hope the public utility commission steps up and denies some of the fuel cost pass-thru for poor planning; else there will be no incentive to plan better next time. In this low gas price environment, utilities should have weatherized their gas units to perform over the winter while also firming some transportation to their gas plants. They should have adjusted their spot to coal contract ratio to be lower. I know it is easier to quarterback after the fact, but last year showed several indicators that low gas prices are very likely. This is not an after the fact quarterbacking session. As the Managing Director Strategic Planning at AEP, I consistently championed the company to diversify to gas and believed in natural gas being the appropriate fuel in terms of managing capital and market risk. Simple fundamental analysis even back in the 2005-2008 period showed gas prices were not going to rise and stay above $10/mmbtu for long. Large LNG projects were lined up with the capability to supply the US markets for $7/mmbtu with a huge return on investment for those investors. In addition, the free market should drive innovation as the price incentives rose from the $2/mmbtu enviroment to an ever growing price slope – as documented in my previous post. Entrepreneurs who thought they could get gas out of shale for less than the market projections came and developed this shale gas revolution.
The big question to whether natural gas prices climb back above $4 will likely be answered by those who can predict the weather. Will this summer be one of the hottest, coolest, or just normal?
I have been evaluating risk, developing scenarios, and forming hedging programs. Please do keep All Energy Consulting in mind for your consulting needs. Let us write you a proposal.
Your Energy Consultant,
Environmental Goals: Is it to Save Lives?
As I discussed in my previous blog on the issue with the EPA analysis on MATS / MACT , EPA’s intent is good, but is it worth it given all the other issues. The logic not only applies to EPA regulations but everything we want to do as a society. I always made this argument with my friends and colleagues who are so passionate about global warming. The resources and capital must be spent from somewhere.
The other important point to discuss is the objective. What are the objectives? Many of these passionate arguments conclude the objective is to save lives. I always espoused if saving lives is your objective there are numerous issues with finite cost that can save lives now (e.g. clean water technology, vaccines, education, etc…). I now have a perfect frame of reference to support my thesis. Bill Gates philanthropic adventures show he has saved lives at cost of less than $5K per person. Remember EPA analysis required $3-7 million dollars per life. Think about some of the cost figures to mitigate carbon. On a per life basis these numbers get very high and the returns are not likely seen till many years later.
A rationale argument, perhaps not too morally preferred, would be those lives are not likely related to you. The low cost lifesaving methods are largely focused in the developing world region. However at the same time the rationale used to promote many of the global climate concerns are from studies documenting the greatest harms will be in third world areas.
I don’t have the answers, but I do know we have avoided talking about the objectives and the cost and the alternative use of capital and resources. Unfortunately, I agree that an optimal decision in energy and/or environment will likely result in subpar results as the money will likely be spent frivolously in other areas. However at some point, we can’t all spend money frivolously/non-optimal. We are seeing the result of this across the world as debt spending was an easy way to support frivolous/non-optimal spending.
I have developed many thought provoking concepts in various policy discussion. Please do keep All Energy Consulting in mind for your consulting needs. Let us write you a proposal.
Your Energy Consultant,
Cross State Air Pollution Rule (CSAPR) Halted – Moral Hazard
Though I may not always agree in the merit of the various environmental regulations, I do believe the courts halt of CSAPR rule was out of line. The rationale of the court and the plaintiff was the regulation was going to wreak havoc on the economy and the reliability of the system. I contend the stay may result in greater havoc for our economy. The utilities arguing for this under the merit of timing are somewhat disingenuous.
The EPA attorneys should note CSAPR is a modified Clean Air Interstate Rule (CAIR). CAIR was issued on March 10, 2005. CAIR was then vacated/remanded in late 2008. The irony is the vacature came from the environmentalist. The environmentalist did not like the fact trading could result in creating hot spots of emissions and could result in no change in downwind states emissions. EPA had to go back and modified the rule so there would be limits on trading, so downwind states will actually see reductions regardless of trading. Utilities expecting CAIR to disappear when it was vacated would have been very foolish. In fact, that is not what occurred. Over the last few years, we saw significant changes to the coal fleet with significant control equipment installation. As noted in AEP sustainability report – “Since 2004, AEP invested more than $5 billion to install state-of-the-art environmental controls that have resulted in significant reductions in regulated emissions from our power plants” I can tell you AEP did not do this for the press release or the sustainability report, but for preparing for CAIR and MACT /MATS along with NSR settlement. The excuse of not having enough time cannot be legitimately used given when CAIR was issued and the fact CSAPR allows significant trading for the first two years. Given a well-designed trading strategy even those ill-prepared plants such as Monticello can continue to run.
There are many assets that have threatened to retire. I would like to call the bluff on many of those. In fact many coal plants, I suspect the owners have financial concerns versus implementation concerns. The best bet for those owners would be to place those assets for sale and / or develop a very aggressive emissions trading program versus retiring, but the threat of retiring allows them to sustain the status quo.
In terms of reliability concern, I would have really liked the courts to have waited for real proof. If they observed brown outs in January or in any other time period, I would have no issue for the court to stay the decision. This premature stay is not conducive for the economy. The court has created a moral hazard. They are making our economy to be reactive not proactive. Those who moved forward and thought ahead and planned are now being punished. Those who waited and did nothing are being rewarded. I understand policies and regulation will likely never be perfect, but if we cannot implement and learn we will never progress.
I have evaluated every environmental program to hit the power sector over the last 10 years. Please do keep All Energy Consulting in mind for your consulting needs. Let us write you a proposal.
Your Energy Consultant,


