“Prophesy is a good line of business, but it is full of risks.” Mark Twain
It has been quite some time since I have posted an article.
The end of the year is a good time to reflect on past prognostications. I do have a list of publicly made prognostications. Of course, my most famous prophecy was the collapse of the oil markets in 1998. I was noted in several publications including front page USA Today. Since then, given my move into the real world from consulting world, my prophecies have been privy to the companies at which I’ve worked. However, you can find some public appearances at conferences where my prognostication skills can be bench marked to reality, I have dug up two from the past – one in 2011 and another while I was running my consultancy in 2015. Both, coincidentally, were at a Platts conference. I seem to do quite well at Platts conferences – perhaps I should be presenting more often there. Last, but not least, the latest news of auto manufacturers layoffs and cutting models made me go back to one of my previous blogs I posted.
The last public statement was made at the Platts Refinery Conference back in 2015. Right after that, I was implementing PMA at EDF Trading. At the conference, I was not given much attention as many of my ideas did no support the on-going trend and sentiment. In addition, I hadn’t spent a lot of time back in the refinery industry – but to be honest, its really not as complicated as power – for me it was easy to pick back up where I left. I rebuilt supply/demand models for each commodity. Reviewed and traced each demand and supply sector and examine key inflection points. I also followed up with respective experts/leaders in each product and had wonderful conversations with them. An expert with passion can’t stop talking :)! Please click on this link for the 2015 Platts Refinery Conference Presentation. I started my presentation noting how all the experts in the industry over the past decades have gotten major trends wrong and I wasn’t excluding myself (e.g. lighter crude slate – peak oil etc…). Many in the rooms did not like to hear this. However, if you ever get a consultant/expert to not review and face the facts of the past and admit their errors – run – run as fast as you can. An over confident consultant/expert can cost you a lot more than their fee. I discussed the current landscape with all the new oil and gas production and how ethane will need to find a new home. Currently ethane exports are almost at my 2024 foretasted export level! Also noted was the possible Naphtha issue and the two chemical feedstock would inevitably collide in the market. All of it came true, and the extent was even more than the tempered forecast I presented. I am a realist in the sense there is no reward to forecasting way above consensus – just being away from consensus is enough to get the point. I had an inclination that the situation could be much more dire than I presented, but I was already going against the grain so I tempered the expectations in the presentation. Creating scenarios also allowed the visuals of the direction of the market – note the high case.
Going even further back is a presentation I gave at Platts Coal Conference in 2011. I was in a similar situation where I had to relay a bad message to the room – and once again, many did not want to hear it. To view the presentation click on the following link – Platts Coal Refining Conference in March 2011. I noted my calculations of coal retirements made when I was Managing Director Strategic Planning for AEP – which was available in the public documents in one of the AEP Analysts meetings presentation. Essentially I was telling the audience that almost 50% of their demand might go away and that exporting would not solve their financial situations. Of course, no one in the coal conference wanted to heed my warning. The KOL etf had already dropped from highs of 50 in the year to 30’s in October 2011. I heard from some that this David person had no idea what he was talking about – because I was a power guy not a coal guy. Hmmm… when most of your demand is from the power sector shouldn’t that be the person you should be listening to? Anyways, the KOL etf is now 12 and we have seen some major bankruptcies in the industry. Export coal is up in volumes but just not even close to drop of volumes from US coal generation. The surprising reflection to note is how well the rail sector has done – perhaps replacing coal with oil and continued Chinese imports – but at some point that will likely end, too.
The latest news of auto manufactures laying off and cutting models made me think of an article I posted back in Feb 2015 which I reviewed the BP Energy Outlook. If only the auto guys took heed to my warnings – “…eventually with the falling prices and the improved efficiency improvement the auto manufacturer can produce an SUV with mass appeal and size that can go 0 to 60 in few seconds yet offer 25-40 mpg. Auto manufacturers who ignore this trend will be left in the dust as was seen last time SUV sales outsold compact vehicles. The move to this larger and faster car will swallow the small vehicles leading to overall growth in oil demand while maintaining the CAFE standards.” US total petroleum demand almost re-hit its monthly peak demand set in August 2005. Overall US petroleum demand has been in an upward projection since bottoming after the financial crisis.
There are many out there denying the ability of human beings to predict/understand the future. Books like Undoing Project by Micheal Lewis and the conclusions that Israeli psychologists Daniel Kahneman and Amos Tversky demonstrated that humans have a breakdown in their psyche creating poor decisions and inefficiencies in the market. They did not examined learned/experienced forecasters and also did not reach out to successful prognosticators. Much of their tests involve normal sample people, not experienced and trained-to-forecast individuals. We are also seeing the rise of AI and neural networks to take the human psyche out of the equation for decision making. However, it is the human that can relate to the human that is making decisions, even if the human is using AI. So far, I have yet to see an AI be able to go beyond short term analysis given its learning sample is always based on the past and the multiple forward inputs still require some creativity and art for which only an experienced person can create. I good benchmark for when AI is ready is when AI starts making art work so profound. At that point, I would say human prognosticators could likely be looking for another career, but until then – For my fellow aspiring prognosticators I leave you with these tips in order to be a better forecaster.
- One. Get a real job in the real industry and eventually in the planning and strategy group. Being a consultant your entire career leaves out the feedback loop of reality and you end up in this strange world of advice giving and not knowing how it really matters to the company and the multiple lives you could impact. This is also a note to companies hiring consultants – get one that has been in the industry in a position of planning/forecasting. They will understand your position best and know the bigger picture of what an outlook/position could mean to you and your company.
- Two. Have a fundamental foundation – examine as deeply as you can the drivers of supply and demand e.g. what are the economics parameters that drive more supply? When and how much does demand respond to price? What alternatives are there? etc.. The devil is in the details – get your hands dirty and get into the details. This is where IF you have passion, it will shine. IF you want to be the best, this is where sacrifices are made. Work longer – sleep and dream the problems – let nothing get in your way – if you really want to understand the market your forecasting. If you don’t, I promise you someone else will, and you won’t be getting it right consistently. Forget all those that say you must sleep so much and rest so much – I believe, when your in the midst of an issue, you must engross yourself and get your rest and leisure later. Nothing worthwhile that can be claimed as a great achievement comes without sacrifices. My first professional boss at Purvin & Gertz, Ken Miller, taught me about having passion for your work. His life was his work. He would carry the largest suitcase full of reading materials everyday. I have never stopped reading as much as I can because of him. He passed away this year, and may he rest in peace – but, knowing Ken, his rest would be reviewing refinery economics. Everyone should have such a boss with so much passion. There is so much that I owe him for showing me the way.
- Three. Be humble – know that you don’t know everything nor do you have to. In the mid 2000’s, I knew gas couldn’t just rise to the teens without something in between. Did I know it was shale at the time? No. But, I did know the principle of greed and human ingenuity. My premise to pull the prices down from the every growing forward curve came from the underlying thought of greed and human ingenuity, and I used LNG as my placeholder. In my calculations, at the very most, prices would be around $6-7/mmbtu. In the end, we see the development of shale was the ultimate greed and human ingenuity mechanism pulling gas prices back down even farther than I foresaw at that time. However, my premise was still right. It was not ever growing as the forward curve/market thought, and I didn’t have to know everything to save the company billions of dollars from jumping into more coal assets and not buying distress gas assets that later sold for multiple times on the dollar. It is so important to reach an understanding at some point in your career that no matter how much modeling and research is done, the world will unfold not even close to many experts predictions. With that humbleness you will open your mind and begin to, more accurately, prognosticate. You will realize and be more open to multiple outcome probabilities. Having ranges of outcomes does not make you weak, but makes you cognizant of the multiple dependencies that are out of your control e.g. weather. However, you will still need to have a base forecast to discuss where things are likely headed as long as all the dependencies likely head your direction.
Over the years, I have come to the realization that humble, but passionate, consultants are the best consultants, as they have been weathered and understand some of the unpredictable nature of the past and very much willing to put in the effort required to maintain expert status. They are confident enough to change their forecast before it is too late and also be brave enough to forecast against the trend.
May you have a prosperous 2019 – and stay thirsty to knowledge!
David K. Bellman
Your most humble, super passionate, and grateful but very lucky prognosticator of the energy market!
Renewables No Impact with Low Oil Price – False
The belief that low oil prices will have no impact on renewable is very misguided and optimistically biased. The practical reality is the path of renewables will be altered with continued low oil prices. Many of those focused on renewables, having nothing to do with oil, are focused on the power sector being isolated from the rest of the world. It is a true statement that renewable generation is likely less costly than oil generation even at $50/bbl. However, in the power sector, the competition is not with oil directly but with natural gas and coal.
The coal market benefits when oil prices are low as transportation can make up over 50% of the end cost of coal. The natural gas markets may results in higher prices as economics of some oil field gets reduced, thereby, reducing the associated natural gas production. However, this may lead to more focus on natural gas finds versus oil finds increasing gas production. At best I think the impact of low oil prices on natural gas may only slightly increase gas prices.
Given renewables connection to electric generation, the amount of renewable will be highly dependent on the amount of electric demand. Also one of the largest mechanisms to de-carbonize came from the conversion of vehicles to electric vehicle as renewable generation offered a potential zero carbon source. Therefore, one of the largest anticipated sources of electric demand in the future was going to come from electric vehicles. However, with low oil prices, this makes the economics of mass electric vehicle adoption very unlikely.
In most cases, the economic break-even of electric vehicles vs. gasoline vehicles requires gasoline prices north of $4/gallon. More likely it would be north of $5/gallon given most of these economic analysis were based on a huge advantage of gasoline vehicles paying for the road infrastructure. This is unsustainable once EV vehicles grow in usage – eventually the road tax will be collected from EV vehicles. Nonetheless $4+/gallon prices are now diminishing in probability as oil price remain below $100/bbl. With low oil prices, this transition to electric vehicles will be limited. In order to transition, a much larger carbon price will be needed which will not likely be politically sustainable. The sacrifice for saving a potential disaster may just be too high for society.
Low oil prices will limit the ability for renewables to grow in the energy mix. The portability of energy is superior in petroleum products relative to any other forms of energy including batteries. This physical attribute of petroleum will require a monetary mechanism to allow a switch to greater renewable forms of energy. A rising crude oil price with transportation north of $4/gallon, and with an expected small impact of carbon allowed many to discuss the potential of a zero carbon system. However, with the recent changes in oil prices and potentially a protracted time period below the $100/bbl mark, many dreams of the zero-carbon world are likely shattered.
The energy markets are intertwined. High oil prices lead to greater opportunities for change. A low oil price supports the status quo. Renewables can continue to grow with current societal goals within the power sector – but the potential will be so much less now than when oil was north of $100/bbl.
Your All Forms of Energy Analyst,
David
David K. Bellman
Founder/Principal
All Energy Consulting LLC- “Adding insights to the energy markets for your success.”
614-356-0484
[email protected]
@AECDKB
Oil Market Outlook Change – Too Low Demand Expectations
BP released their 2015 Energy Outlook. As noted by their Chief Economist this is not to address prices or near term events. However, price, in the end, is the meat of a discussion for an energy outlook as price and outlook for supply and demand are intertwined.
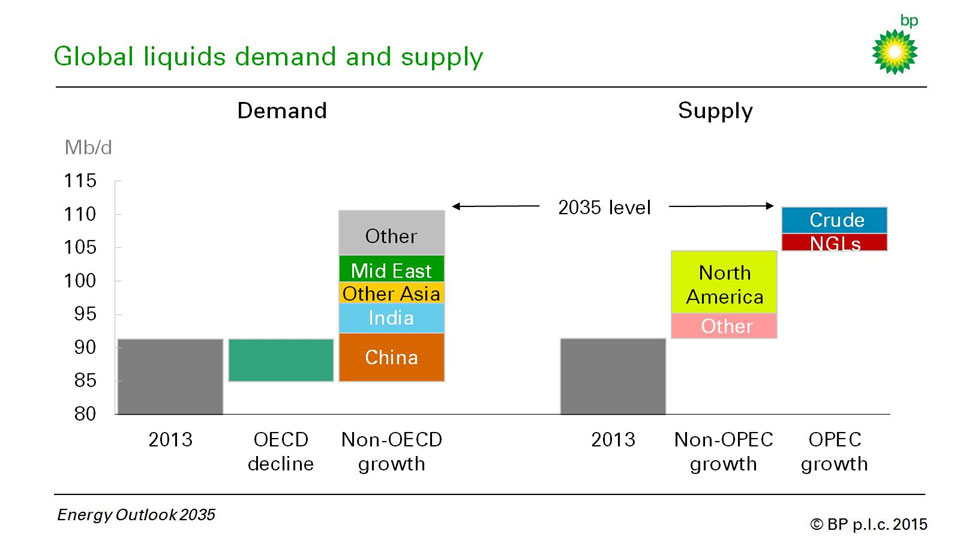
The outlook by itself is useful to gather facts and trends. The real value for someone like me comes from the change in the outlook. In theory, the process of formulating these outlooks should not change. Therefore a change in outlooks signifies a change in market place expectations. The best slide in reviewing the change to show the dramatic shift in expectations is slide 13 in the presentation. The latest forecast for 2035 shows a very small call in OPEC <5 million barrels/day see figure below.
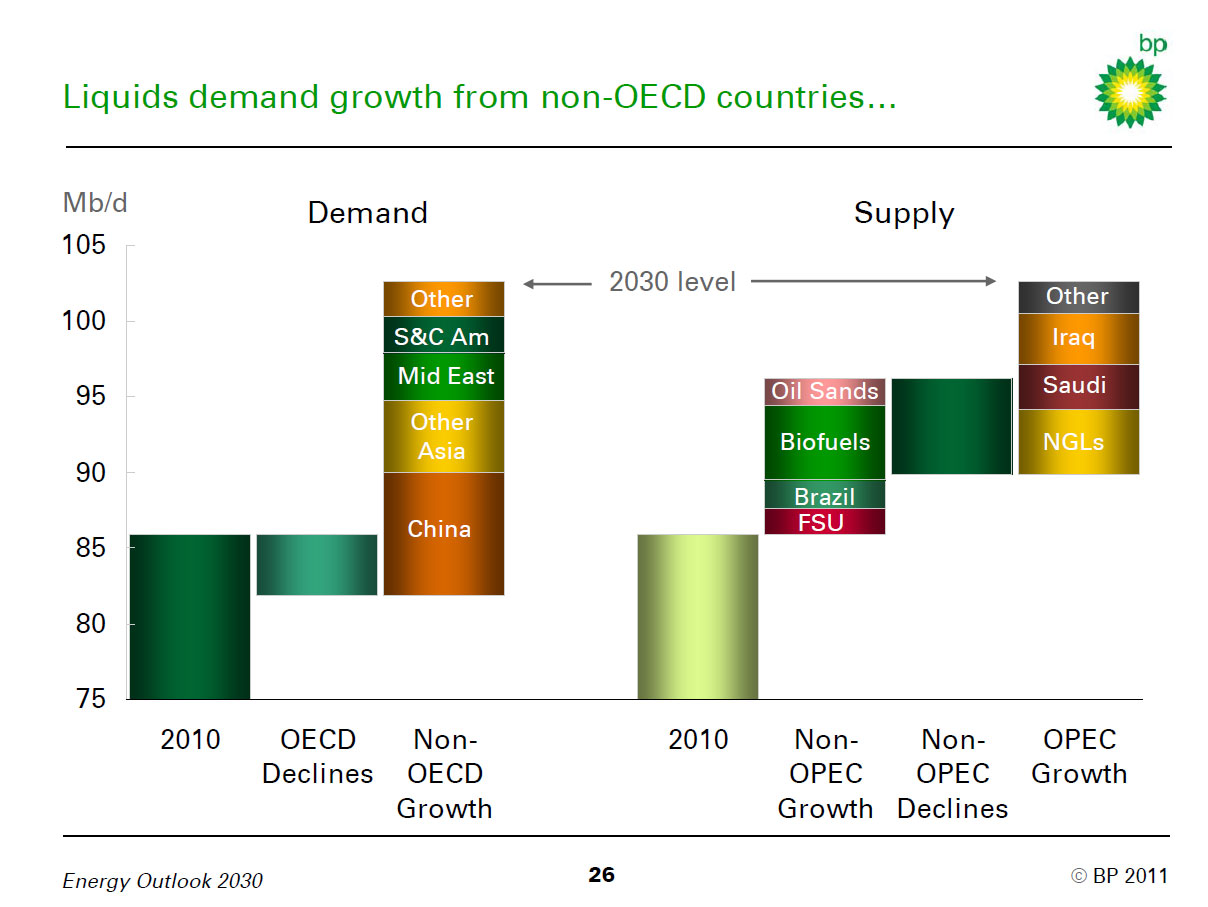
If we go back into time and look at the very same slide in 2011, we see the call for OPEC in 2030 (even less demand requirement given 20 year gap vs. 22 year gap in current forecast) amounts to over 10 million b/d. This is a dramatic swing see figure below for 2011 BP Energy Outlook.
IF one believed in the process and the forecast output, the shift between the two forecasts would dramatically drop the expectations of crude oil price. As a longtime forecaster of the crude oil markets, the call on OPEC is key component on price forecast. This piece of the puzzle represented the additional swing from OPEC who, in theory, purposely holds spare capacity to sustain a reasonable market level. With the need of OPEC being diminished, the overall pressure for oil prices to move upwards is limited.
Obviously, BP cannot state or present a price view given its role in the market place, but if their trade floor was made well aware of this trend and believed it, they would have made a good call over the last year. However, the long-term aspect of this trend does not bode well for BP as a company. In fact, the overall energy sector would not benefit from this including renewable energy and refining industry.
The demand side also shows some major shift in expectations. In 2011, the expectation for China oil growth was nearly 10 million b/d more than the base year (2010). Now expectations have fallen to around 5 million b/d from the base year (2013). The interesting outcome of this is whether BP flowed back the price response from the expectations of lower prices per the lower call in OPEC to the response of China demand. To lose 5 million b/d would require a much lower expectations of GDP outlook, in addition a very inelastic response to the price of oil is needed to maintain such a drop in demand. OECD demand decline is nearly the same – yet the price expectations from 2011 to 2015 must have dropped.
From my experience, the demand piece is typically the flawed portion of the forecast after coming off a major supply shift. Supply can be well understood in terms of cost of development and potential technology improvement curves. It is my belief that the demand outlook presented is too low. The expectations of this come from both the price feedback of consumers and the fact that the demand side has included a significant portion of efficiency improvements over the past few years.
Efficiency improvements do not lead to reduce consumption of a commodity without a continued price increase. This is supported by the Khazzoom-Brookes postulate and Jevons Paradox. My caveat to the theory is to add the price component. Improving efficiency of a commodity leads to more use of that product without a corresponding price increase. I also expect this with electricity as we make up for the large efficiency improvement by having more devices and more appliance than we had a decade ago, even though, a single appliance may be 50% more efficient.
I do not expect our human desires to have a car that is faster and bigger to be different by region or time. Corporate Average Fleet Efficiency (CAFE) improvements have and will result in near-term gasoline demand improvement in the US, but eventually with the falling prices and the improved efficiency improvement the auto manufacturer can produce an SUV with mass appeal and size that can go 0 to 60 in few seconds yet offer 25-40 mpg. Auto manufacturers who ignore this trend will be left in the dust as was seen last time SUV sales outsold compact vehicles. This move to this larger and faster car will swallow the small vehicles leading to overall growth in oil demand while maintaining the CAFE standards.
This mass appeal will also eventually migrate to other areas of the world. The ability to stop this rebound is the corresponding price. In the oil markets that seems to be muted as expectations of price is likely between $50 to $100/bbl and not rising over $100/bbl for the next decade or so. Power markets may thwart the rebound given the trend in transmission and distribution cost, but this will be highly dependent on the region. Obviously adding a carbon tax would increase the cost curtailing the demand.
Please consider All Energy Consulting for your energy consulting needs. We offer a unique and fresh perspective on the energy markets to help you succeed
Your Fundamental Supply / Demand Energy Analyst,
David
David K. Bellman
Founder/Principal
All Energy Consulting LLC- “Adding insights to the energy markets for your success.”
614-356-0484
[email protected]
@AECDKB
Eagle Ford What Are You?
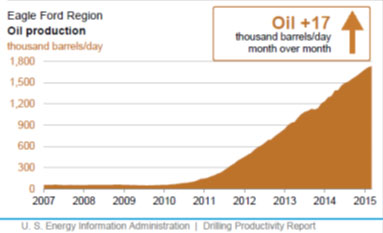
“May the real Eagle Ford stand up” is another title I was thinking for this article. As I get ready to launch Oil Market Analysis,one of the areas I have been focusing in is the condensate issues in the Gulf. In particular, the production from the Eagle Ford region – see figure below.
There is much discussion on this production being mainly condensate. Condensate is a crude oil – just a really light crude oil. A common unit of measurement for the density/gravity of the crude is API. The higher the API, the lighter the crude oil becomes. Some consider 45+API to be condensate. Most condensates are also extremely low in sulfur – very sweet. To put it into context LLS is around 36 and WTI is around 41 API. There is an issue in being too light – but you can never be too sweet (such is life). Your product yields will suffer particularly in the No. 2 cut (Diesel, Heating Oil, and Jet). Also being so light, in a refining region not expecting this trend, causes operational issues that can be addressed overtime given the right pricing incentive.
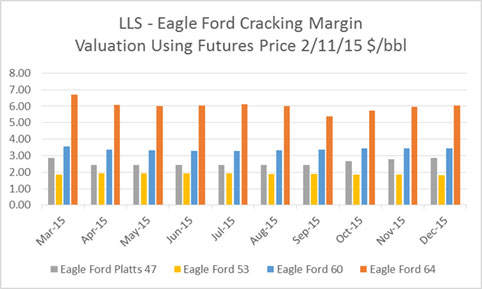
I have gathered 4 different assays of Eagle Ford. They range from 47 to 64 API. Platts own price marker methodology notes the range of assays from 40.1-62.3 . They settled upon a 47 API. They also note the cut range used and I adjusted another assay to reflect the Platts assessment seen in the figure below. The other interesting thing to note is there seems to be an Eagle Ford and an Eagle Ford Condensate marketed. This may explain the large variance. However, regardless of the marketing, the value of your Eagle Ford as a refiner can swing significantly. Below is the cracking value of the various Eagle Ford assays relative to LLS from our USGC cracking model, from our Oil Market Analysis Platform using the futures market strip on 2/11/15.
Cracking valuation models are strictly based on the yield and product value. This does not take into account the logistic issues of having to truck condensate, which could easily add another few dollars to the discount of Eagle Ford. The model does take into account the quality issues for both octane and sulfur. Having run and managed the South Louisiana Quality Bank, crude quality can have significant ramifications. Declaring a label of Eagle Ford, given the variations of quality, will likely not mean much. Contracts dealing with Eagle Ford will have to have quality specifications and processes to deal with variations.
The largest driver among the various assays is the amount of diesel and jet produced. In some assays, we produce too much light ends, making a limited amount of finished gasoline and left with Naphtha. This drives the discount seen in the Eagle Ford 64. Increasing the reformer capacity is needed.
To deal with the lighter crudes, more reformer capacity will be needed along with greater alkylation. The octane values from these lighters crudes are not high, at least from the data I have. The discount to Eagle Ford will come in some, over time. This will not be due to the ability to export the crude oil. The export market is expected to be ultra-competitive when it comes to condensates (discussed at a later time). There will be operation issues in the US as refiners adapt to the new feedstock. These issues could include needing to run your crackers less; thereby, likely impacting heat balances. However, these are solvable engineering issues, given an economic incentive. The infrastructure of Eagle Ford is being built out. This will lead to a reduction in discount as the transportation cost is reduced. Eventually the market will see a uniform stabilized Eagle Ford blend. Until then, pay attention to your quality specifications in your contract and hopefully leave room for adjustments.
By the way, I will be speaking at the Platts 4th Annual Refining Convention in May – See agenda. I will be addressing the issue of condensate and NGL’s in the market and what we can expect to see in terms of market forces in the future. I hope to see you there or even sooner. Please do consider All Energy Consulting to help you in the crude oil and refined products market space.
Your Crude Processing Energy Analyst,
David
David K. Bellman
Founder/Principal
All Energy Consulting LLC- “Adding insights to the energy markets for your success.”
614-356-0484
[email protected]
@AECDKB
Oil Price Drop Impacts Part 2 – The Bright Side!
The oil price drop is not all bad for the energy sector. In our first part on the Oil Price Drop, we examined the fallout that will occur with Renewable Fuel Standard as a result of the price drop. With the completion of our USGC Refining Models, we review the dynamics in the region and have great news for those downstream and a positive highlight for certain upstream players.
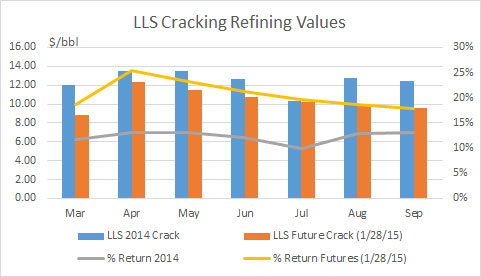
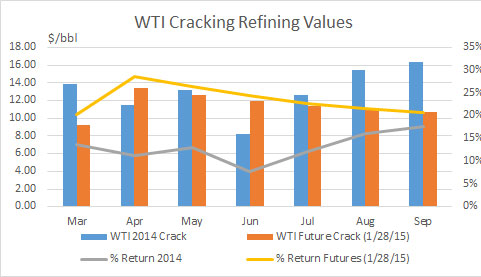
For this analysis, we present the information ignoring the dynamics of the renewable fuels standard, which we will discuss at a later time. The focus is to compare the change from 2014 to 2015 therefore any issue of RFS will be reduced given similar circumstances for 2014 and 2015. The figures below represent the calculated margins from our USGC Cracking configuration refinery for LLS and WTI. The 2014 figures represent last year actual results whereas the 2015 uses the futures market on 1/28/15 to represent 2015 March through September (longer time period available – please contact us for information). With Oil Market Analysis (OMA) product/service, we will actively publish the results daily using the latest futures market with an ability to go back into time. You will be able to also upload your own forecast of products to recompute expected margins based on our yields per our refinery configurations.
Given the drastic swings in crude oil price over the last decade, I focus on the returns versus the absolute cracking margin. Returns are calculated by taking the value of refinery yield over the cost of the feedstock. Being able to sustain reasonable returns supports the industry. Producing a $10/bbl margin in a $100/bbl feedstock world is not sustainable given the risk in the market place even though $10/bbl margin historically would have been a wonderful dream for many refineries in 80’s and 90’s. The bright side is the refining world is showing returns of over 20% compared to the low teens observed in 2014. Also I suspect, even though the absolute margins are down from 2014, refineries may be able to make up the dollars through increased volume as demand will be much higher in 2015 vs. 2014.
Not to leave out the upstream folks completely out of the bright side, we examined the changing landscape of condensate given the enormous production growth from Eagle Ford. Though the indexed crude oil price is down over 50% from last year, the discount to the condensate has narrowed given the futures product prices outlook. Refiners should not be so aggressive in asking for discounts to Eagle Ford. This could change as Naphtha price and octane value could move in opposite direction (Naphtha down and Octane Up) increasing the discount asked by refiners.
All Energy Consulting offers our market based approach on refining to assist producers and downstream participants in understanding the market risk. We work with you to develop a collaborative view of the future and the risk it holds. Please do consider us for your consulting needs as we are here for your success and have a proven track record of successfully identifying the paradigm shifts.
Your Energy Analyst,
David
David K. Bellman
Founder/Principal
All Energy Consulting LLC- “Adding insights to the energy markets for your success.”
614-356-0484
[email protected]
@AECDKB
Modeling the USGC Refining Market
I had planned to continue to discuss the impact of oil prices beyond the obvious. In the first report on the impact of oil prices in the non-obvious areas, I discussed the likely impact to the Renewable Fuel Standards. I was hoping to follow up that report with the impact on condensate value as a result of the crude oil collapse. However, this has lead us into reviewing our refining models and also how the refining industry will likely have to evolve to handle the RFS.
As with many things in the energy market, you start with a hypothesis and investigate it only to be compelled to look at other areas in the market place. We are almost ready to release our first oil product, Oil Market Analysis (OMA), but first we had to make sure the refining models represented the USGC and was designed to incorporate the impacts of RFS. In this article, I have decided to go ahead and give you a tour of my problem solving methods when it comes to modeling USGC Refining Markets.
A key path for how I analyze the energy markets is to take a walk back in time.
Historical Changes in Refining
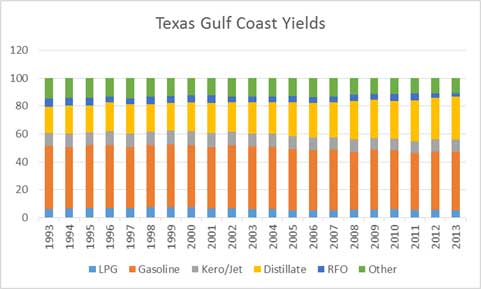
The yields of the USGC refiners have changed. Distillate yields rose while gasoline yields had the largest drop off.
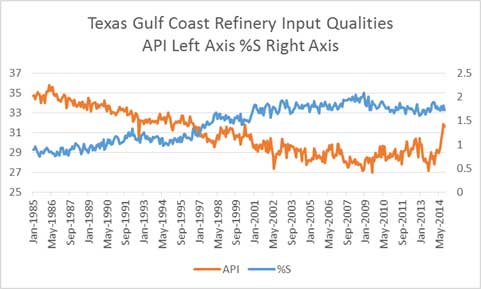
This was not a result of refiners’ strategy from the 90’s nor was it because of the crude slate changes. The primary driver for this change came from the market price change starting in 2005.
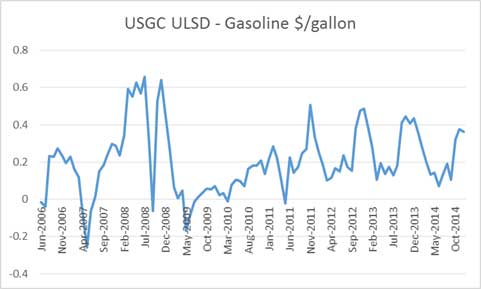
The EIA Annual Energy Outlook (AEO) was forecasting distillate spread to gasoline to be negative until the 2010 AEO release. The current AEO 2014 shows the spread averaging over $0.3/gallon. As with all free markets, they adapt to the pricing incentive. This change necessitates the adaption of the USGC refining configurations. This is also one of the reasons condensates are poor crudes relative to other crudes in the market as the distillate yield is very small.
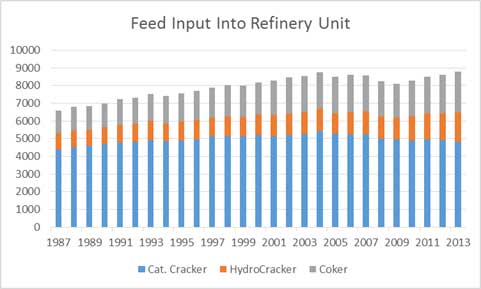
The quality changes did help the refineries produce more distillate, but many planned to expand and run their Catalytic Crackers and Hydocrackers. The price incentive has resulted in cutting back how hard those units run.
Calibrating USGC Refining Model
The first piece for calibration is putting a recipe of crude oil entering the USGC cracking and coking refineries. The average API for the last 12 months average around 30.2 API and 1.7 %S. The import data shows the major importers of oil for USGC are the Saudis, Venezuela, and Mexico. A crude slate from each of the countries were selected. Most of the import volumes were sent through the coking refinery. For those not knowledgeable in refinery – all coking refineries do have “cracking” capability via hydrocracker or cat. cracker. A blend of LLS, WTI, Mars, and Condensate represented the domestic blend. The volume on the domestic side went through both a cracking and coking refinery. The final recipe produced an average 30.5 API and 1.7% S.
Both refinery configurations were then adapted to produce similar yield seen in the market place. The refinery levers represented modification in cuts going into the various units along with conversion capabilities. We also looked at the market signals from octane values to maximize the refinery capability to produce high octane components.
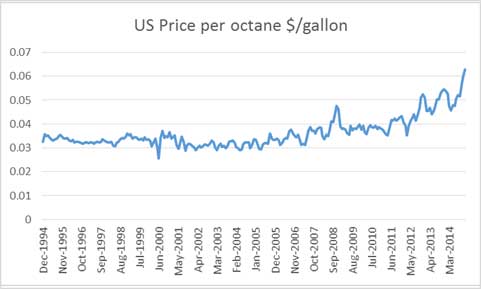
Octane pricing is a story in itself. The increase in value corresponds with the increase in condensate production. Condensates typically produce low octane products – another issue for condensates.
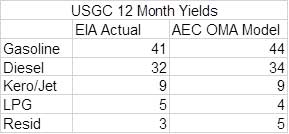
The final production of our represented cracking and coking unit in the USGC produced the following yields compared to the actual market production.
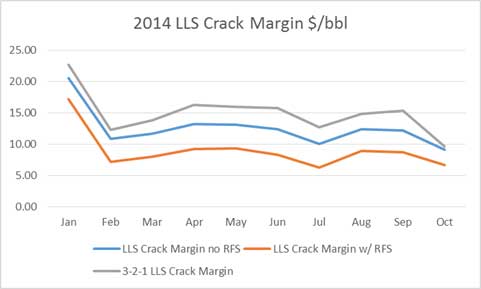
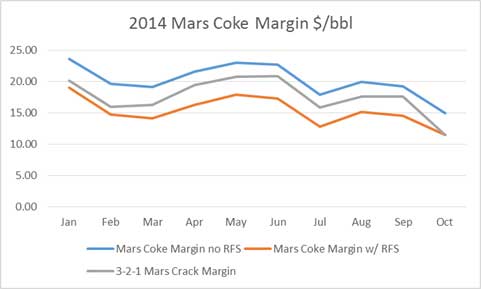
We then review the historical refining margins produced by the model depending on configuration and crude oil. The issue is whether we account for the ethanol requirement. As a crude produces more gasoline, the requirement for ethanol purchases are needed. Balancing some of the cost is ethanol octane is at 115 vs. 87 spec. For comparison, we use the simple 3-2-1 crack spread commonly used in the market place ( [2 x Gasoline Price + 1 x diesel]/3 – Crude Reference Price).
The yield and final market margins are the key step to how well your model is performing. Similar to our extensive work in calibrating our power models, we put the same effort into the refining models. We believe in transparency and show all our calibrations. As with any model, one can continue to improve upon it over time, but we will not be stuck in analysis paralysis. For vintage #1, we are pleased with the results.
Work in Progress
The results are promising. We will be filling our yield tables with various crude assays. The outcome of the work – Oil Market Analysis (OMA) – will produce monthly market expected refining margins based on the future markets. There is no need to wait for your consultants to put out a report days to months after the market has moved. OMA will be updated at the end of every business day keeping you on top of the market changes. The analysis will indicate the expected refining margins for gulf coast refiners. This will be helpful in guiding the valuation and expected earnings for USGC refiners.
An interactive website will be developed allowing users to select various crudes. This can be used to help guide crude oil optimization from pricing for contracts to informing buyers and sellers of arbitrage opportunities. The interface will also allow users to upload their own forecast of petroleum products or choose from All Energy Consulting custom forecast. With this capability, a user can customize and create endless amounts of insights. An end goal will also be to allow users to upload their own assays to be automatically run through our models. Currently, we can do this manually as this process requires some tricky programming to automate this feature.
Another thing we can offer is generating a model for East Coast, Midwest, and West Coast. The process and procedure will be similar to the above. Also, an international model could also be possible if we can find the information needed for calibration. Using this model, I plan to produce a report to calculate the value of condensates and further delve into the rapid growth in octane value.
Lots of fun analysis to do – who needs to sleep or eat?
“People who love what they do wear themselves down doing it, they even forget to wash or eat….When they’re really possessed by what they do, they’d rather stop eating and sleeping than give up practicing their arts.” Marcus Aurelius, Meditations
Your Tireless Energy Analyst,
David
David K. Bellman
Founder/Principal
All Energy Consulting LLC- “Adding insights to the energy markets for your success.”
614-356-0484
[email protected]
@AECDKB


