Weatherization Assistance Program True Colors
I came across an article titled “Highest Recovery Act Job Creator” , which is really just reporting the article found on the recovery.gov site. The reporting initially is perceived to be a positive report card for the Department of Energy low-income Weatherization Assistance Program (WAP). The positive notes touted:
- 2nd out of 200 federal programs in job creation
- Top ten for Recovery Act in terms of creation and retention
- Saved $320 Million in energy cost in just the first year
- Reduces home energy use by 35%, saving $400 per household
- More than 600K homes
As reported the numbers seem fine, but let us do some math. In the same article, they note the following:
- WAP cost $5 billion
- Created OR retained more than 13000 jobs
Given my concerns about the cost, whether it was actually spent or even appropriated, I searched the database to evaluate the awards given for the program. From searching the recovery.gov database for CFDA code 81.042 Weatherization Assistance for Low-Income Persons:
Total Awards
1,384
Total Award Amount
$4,885,043,224
The $5 billion figure would seem to be the appropriate cost the taxpayer has spent to achieve the above results. The government could have reported the following results in this manner:
- Program cost per employed $370K ($5 Billion/13,500 jobs)
- Almost 20 years on a non-discounted basis to break even on energy savings ($5 Billion/($400*600,000 homes)
The above stats when presented in that fashion does not look so appealing. I know many argue, and rightly so; job creation is greater than the one year. However, these types of jobs are not sustainable as one can only do so much weatherization. Parks and services would generate more sustainable jobs and at a much lower cost than weatherization. In terms of the energy savings, it is a small number because the fact is energy prices are not that high relative to the value it brings as compared to a cup of coffee. Who is saving the $400? Low income housing energy prices are subsidized to begin with. There are several nuances with low income particularly section 8 housing. I have seen where the land owner pays the utility and other cases where the tenant pays, but its average use is rolled into the calculation of the rent. Either way the “return” to the tenant is not clear. It is possible some of these projects are just funding the owner.
The scary thing for me is to see that this is the #2 out of 200 federal programs for job creation. I hope the others have better calculated stats.
At All Energy Consulting we pursue on looking at various issues in numerous lights. This is the only way to make sure bias viewpoints are removed.
We positively and evocatively challenge the current thinking involving any aspect of energy use. We look for projects that offer meaningful, transformative, with impactful outcome to the marketplace or society (see projects).
Please consider All Energy Consulting for your consulting needs.
Your Energy Consultant,
David K. Bellman
6143560484
Green Energy Better and More Sustainable without Subsidy
There is no doubt in my mind that green / renewable energy is capable of being sustainable without subsidies or even a CO2 price. Articles such as the one I recently read put doubt in many readers as they approach the issue on the basis of competition with fossil fuel. With subsidies and a CO2 price, renewable energy will come into the market; but the adoption into society as the right thing to do may not come as quick. The role of the government, as many see it, is to not only provide for essential infrastructure (roads, police, etc…) but to also induce appropriate behavior. Our decision on appropriateness can range significantly. Personally, I believe appropriate behavior will develop and be produced from innovators capitalizing on the fact that people will make good choices when someone makes it easy for them. This is an optimistic stance on humanity in that the premise is that the natural tendency is to do good. Let me caveat my statement, major behavior changes involving humane treatment for our fellow men do require government intervention (e.g. slavery, racism, etc…) to progress in a timely fashion. In terms of renewable, innovation in marketing and advancing the value of renewable has been very poor. I would suggest a reason for this is the subsidies. Subsidies have crowded out the innovators and put the path for renewable in the hands of mega-corporations. Significant lifestyle innovation does not come from large corporations, though much credit should be given to them for lowering cost of production for renewables.
I want to focus my case for renewables without subsidies on the organic food industry. The organic food industry was far from being promoted by the US government. Organic food trend also encompasses the desire to purchase local farmed products. There was no subsidy or “push” by government. The product is a premium in cost compared to the non-organic food. However through the innovative entrepreneurial spirits of people involved in companies such as Whole Foods, Trader Joes, etc… society has a rather large and growing organic food industry. This was not done by pushing cost to people who could not afford or see value from it. A decent portion of society has naturally decided that it would be appropriate to purchase from local farmers and to reward organic food producers and marketers. Those who could initially afford it eventually allowed more people to afford it later – as seen by Walmart offering organic food.
There is no doubt in my mind someone can take a segment of the economy to push forward into renewables. It is matter of changing the approach and tact on renewables. So many people have a deep commitment in green living, but act so little upon it. When I note some of the hypocrisy in their lifestyle choices, many note they don’t plan to change their lifestyle significantly unless we all do it. This is the failure of leadership. In addition, it shows no one has learned to extract a potential revenue stream. Someone needs to be able to create a mechanism where it makes it easy and desirable to be green. True innovation requires innovative marketing. People are always trying to relate renewables with fossil fuel. Learn from Apple, my Apple fanatic friends would give no credence to any competition/comparison with the PC. I can envision the possibility of creating communities /neighborhoods where people choose to pay a premium to live a renewable and efficient way of living. Obviously I am not Steve Jobs of renewables, so I can only envision so much in the future on how this revolutionary way of developing renewables may unfold. It could be quite a game changing event, if people chose a lifestyle that would incorporate and unify the energy incentives of the developer, property manager, and tenant.
A better tomorrow can be achieved if we realize the individual and the various actors involved in energy use cannot make the time to individually make appropriate lifestyle decisions when in aggregate make a large difference. Energy is a means to an end. An innovator is needed to make it easy and desirable to change our choices. As Steve Jobs has said “A lot of times, people don’t know what they want until you show it to them.” Remove and/or transfer the mechanism of subsidies to the innovators not the corporation, if you truly want society to massively and effectively adopt renewables and efficient living.
All Energy Consulting is committed to deep thought and thorough analysis.
We positively and evocatively challenge the current thinking involving any aspect of energy use. We look for projects that offer meaningful, transformative, with impactful outcome to the marketplace or society (see projects).
Please consider All Energy Consulting for your consulting needs.
Your Energy Consultant,
614-356-0484
Renewable Portfolio Standards – Require a Portfolio
Many utilities fulfill their renewable portfolio standards with very few options. The easy way for the utility is to do a Power Purchase Agreement (PPA). Most PPA’s are for wind as it has been the economic leader of the renewable choices. Essentially, the utility typically requires the commission to approve the agreement. Once the commission agrees the PPA becomes a cost pass thru. Given the numerous market structures throughout the country, the cost recovery is done through various mechanisms. In the end, the rate payer will pay whether they like it or can afford it. The worst form of cost pass thru is where the utility puts the cost in the distribution rates. This obscures the tracking of actual generation cost.
Regardless of the mechanism, utilities incentives to do renewable is to avoid costly penalties which are typically paid by shareholders not rate payers. The PPA usually will not mandate the developer to a fixed amount of volume. There is a performance criteria and several demonstrated calculations proving a certain yield is very likely. However, as we all know Mother Nature offers no guarantees. I can envision a year where the sun does not shine or the wind does not blow as much as predicted/expected. This could lead to a massive short of renewable credits. In developing an Integrated Resource Plan (IRP), much focus is given to reliability. Therefore a diversity of various generation options (baseload, intermediate, peaking, and market purchases) is a typical outcome. An IRP should strive for robustness not optimal planning, since the future is quite unpredictable and electricity is a unique commodity with limited storage and particular characteristics to maintain (e.g. frequency). I can tell you from multiple experiences, when the lights are out many would gladly pay more for better reliability.
If utilities would approach their renewable portfolio standard similar to their IRP, it would suggest a balanced portfolio approach. The portfolio would give some added value to the higher upfront capital risk projects such as geothermal and biomass. These types of generation would represent the baseload of the renewable portfolio. This will allow for a consistent level of renewable regardless of weather conditions. Adding to the diversity of the portfolio in many instances, I would suggest the utility to actually invest a portion to develop and operate renewable assets versus PPA. Given the similar operating features of geothermal and biomass to fossil fuel units, they would make an ideal candidate to be owned and operated within the renewable portfolio. In the long run, the capital spend will also likely payoff for the utility shareholders. As discussed above current wind PPA’s are just passed through with all the value going to the developer. An investment in actual renewable baseload generation allows the utility to capture some return on investment.
I have much experience in the renewable world. I have served on the technical review panel of the National Renewable Energy Laboratory (NREL). In addition with my utility planning background, I can bridge the two areas to help you create a robust renewable portfolio.
We positively and evocatively challenge the current thinking involving any aspect of energy use. We look for projects that offer meaningful, transformative, with impactful outcome to the marketplace or society (see projects).
Please consider All Energy Consulting for your consulting needs.
Your Energy Consultant,
Gas Producers Entering the Power World
A question was asked “could you blog about the strategy for a gas producer to participate in the power market as an independent power producer (IPP)?” Given my background in both Oil & Gas and Power it puts me in the perfect position to discuss this.
Let me first start simple and then build up to be a large scale IPP. The question posed was black and white in terms of participating in the power markets as an IPP. However, it really isn’t that black and white. There is potential strategy for the gas producer to unite with the power markets without actually operating a facility. This can be as simple as acting as the hedging agent for the utility. We see many people try to emulate the coal markets with their long-term contract arrangements. The difference for gas is the product is fungible – a molecule at Y is essentially the same as the molecule at X. This cannot be said for coal. Coal products are non-fungible with unique characteristics. Therefore building a coal plant with a boiler specified to operate with certain characteristics puts the power generator at fuel risk without a long-term contract. Beyond the equipment flexibility, fungible nature of natural gas has allowed the forward gas markets to be active and representative to the actual market in the near term. This cannot be said for coal as the coal forward market does not represent a significant portion of the physical market. Therefore, utilities, who would like a fixed price on natural gas price, can obtain a fix price by participating in the forward gas markets. There are several utility executives who would like to deal with gas like coal, but by doing so, all they are doing is shifting the burden of the hedge to the producer. There is still value for them to do this, as long as the premium of the hedge is understood. Shifting the hedge to the producer will allow the utility who is typically lean on the balance sheet not to be concerned about the fluctuations to the market. In theory, the producer should be able to hedge the gas better than the utility since it is their business therefore economy of scale should play into it. The premiums of the hedge will certainly be passed onto the power generator with a little return for the added risk. I suspect a small producer could not fill this role for the utility, since the counter party risk could be too great relative to the value of the producer. In a de-regulated environment, it is essentially betting on a position, which is no different than fixed coal pricing if the price is low enough. Clearly a bad deal will result in both parties losing in the end. Teaming up with a regulated entity to supply a fixed gas and volume has many significant advantages once the public utility commission has approved the deal. There is less risk of not being paid as the market risk is essentially being socialized.
The large scale alternative for the gas producer to act as an IPP offers many competitive advantages along with the associated challenges. This strategy still is not black and white. There is a potential to take small enough volumes from various fields and qualify as a distributive generator. The technology has progressed in the micro-turbine world to make it economical. This volume will not be large, but could work well for areas having to flare gas. In essence, most of the generation will be used to supply internal energy use, and on occasion be used to support the grid. Once again, depending on the market dynamics the challenges will differ. ERCOT related markets, where most of the market and several actors are de-regulated; more upside value can be captured. Markets with significant regulated actors could compress margins as their returns are less a result of optimal decision making, but more on the approvals of the public utility. In today’s market of essentially zero yields for cash, it becomes a very compelling reason to put your money to work. The power sector can bring a relative consistent return with a conservative outlook. Building or acquiring a combined cycle can offer decent returns with upside potential. Examining the cost of production of some shale plays, it makes sense to have part of the portfolio of production sold with upside potential. By operating a combined cycle a producer can essentially sell their production with an upside potential. There are locational issues which must be examined, but I suspect given the various transmission initiative for renewables, gas units can piggy back on that infrastructure build out.
There are several other key points to consider and local market analysis needed before producers jump into the power market, but I am sure there are several markets/situations it will make sense for producers to be more active in the power sector. Actual implementation will require back office support. The positive note most producers already have some form of risk group and a trade floor. If you are a producer, please do call or email me as I can help guide/assess/re-affirm your decisions [email protected] 614-356-0484.
EIA Annual Energy Outlook AEO 2012 Points of Interest
Each year when the EIA releases their Annual Energy Outlook AEO, there is much talk about the results. The problem I find each year is trying to understand the change in the relationships between various markets. This is a function of the underlying model they are using. They are using the NEMS model which uses a general equilibrium concept. Personally, I never felt modeling should be left to the model. General equilibrium models are very dependent on all the experts to enter the relationships. Then the model will model those relationships. However, if you don’t have an expert of all things, the model may produce interesting relationship changes; since these experts are experts without integration.
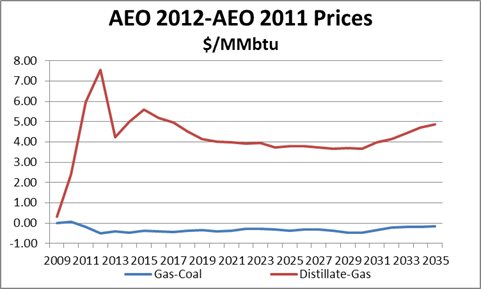
My quick review focused on the Natural Gas, Coal, and Distillate: This is largely because the power market comingles these fuels, therefore, these relationships should be acted upon by the power market. Below are the gas price comparisons to coal and distillate deltas to the 2011 AEO deltas.
AEO 2012 decided in this year’s outlook that the oil spread to gas will be larger than last years by over $5/MMbtu. The gas to coal spread will decline by $0.30/MMbtu. This is largely a result of coal prices being stronger than gas prices being weaker.
Given these relationships before examining the consumption numbers, I would believe that more gas will be in the power sector. Coal use should decline. There should be some gas to liquids (GTL) at some point given the large economic incentive.
The consumptions on a high level show coal consumption being 10% less – no surprise there. However, total gas consumption is essentially the same as last year’s AEO 2011. Digging deeper the power sector use of natural gas climbs over 12% from last year’s AEO. Where is the demand for gas falling to keep the totals the same? It would seem the EIA has a more bearish outlook for natural gas use in the industrial sector and commercial sector. The commercial sector falls 7% which perhaps can be accounted for by efficiency improvements. Industrials seem counter intuitive given the many chemical projects recently announced.
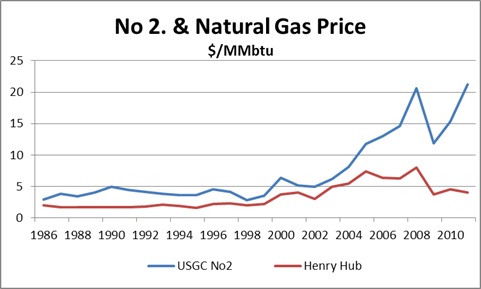
Coal to liquids (CTL) demand fell by half, directionally correct since coal prices are higher but certainly not to the degree that liquid prices are higher. Interesting to see no gas to liquid (GTL) demand. I understand the complexity of GTL (I have a BS Chemical Engineering degree from the University of Texas). Numerous reports suggest GTL likely many years out. However all those reports were written when gas and oil were much closer to parity in the United States.
In addition, the driver for GTL was for stranded gas not in the US. The US innovative market structure plus the sustained large spread between gas and oil should lead to GTL development. My skepticism in GTL lies in the premise the spread will be that large for such a sustained time period. Based on my assessment, the amount of natural gas usage in the power sector is still too low by around 20%. It would be hard press to maintain the coal fleet as it ages with gas prices below $5/MMbtu for the next 10 years. In terms of balancing capital and environmental risk, no other form of generation can beat natural gas for baseload demand across the country. New coal units cannot compete with new natural gas plants with gas-coal spreads less than $3/MMbtu. Around $3/MMbtu, it is marginable and when considering the CO2 risk, it would take spreads closer $4/MMbtu+. Commissions approving coal plants in this environment are typically incorporating other unrelated energy economics (e.g. local jobs, resources). The only thing that haunts natural gas is the price spike seen in 2005-2008. However, if you think about the catalyst that drove that price rise, hurricane Katrina, it becomes less likely to vision in the future. Shale gas has created another layer of gas in the supply curve, which is less sensitive to gulf coast storms.
Further analysis of the AEO is warranted. A certain credit must be given to them for being the pundit willing to go out on the limb and supply every bit of information. I don’t usually agree with the EIA forecast, but they have made great strides in their forecasting ability. They have incorporated more reasonable capital cost projections. They are a good benchmark for modeling. We can only wish other countries around the world would emulate the EIA in supplying historical information and estimated forecast figures.
Market assessments and market forecasting are one of our specialties.
We positively and evocatively challenge the current thinking involving any aspect of energy use. We look for projects that offer meaningful, transformative, with impactful outcome to the marketplace or society (see projects).
Please consider All Energy Consulting for your consulting needs.
Your Energy Consultant,
Energy Efficiency Reports – A tale of two bias reports
Before I jump into this blog, I want to state some obvious statements. Energy is a means to an end. The use of energy typically increases the well-being of the individual. Being more energy efficient produces better productivity by freeing capital to be used elsewhere. No one strives to be wasteful, but the law of entropy requires work for us to be more efficient. We do have thresholds where our behavior (e.g. laziness) will change.
I came across this report/blog by the CO2 Scorecard supposedly debunking the numerous reports/articles not shining a very bright light on efficiency – in particular the Breakthrough Institute (BTI) report. I will say both reports did a fine job in highlighting various variables important in understanding the efficacy and impact of efficiency. The CO2 Scorecard tries to compare various micro topics with very broad BTI topic. At the same time the BTI did not stick to their broad topic of energy consumption by selecting individual cases such as lighting to demonstrate their concerns. Each alluded to Jevons Paradox, but did not follow the true principle/theme Jevons Paradox. Clearly Jevons noted resources. Electricity is not a direct resource, but a creation from resources, which is later used as a resource. It is the underlying resources which derive energy consumption – British Thermal Units (Btu). Saving in electricity does not necessarily conclude savings in resources and/or energy use, which I will show below. Changes in the use of electricity will have micro impacts which are lasting as the CO2 Scorecard noted on refrigeration, but this does not change the macro premise of increasing energy use as you become more efficient.
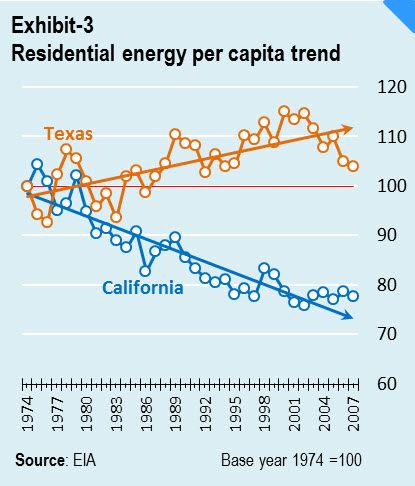
CO2 Scorecard certainly presented more graphs and supposed data supporting their thesis that efficiency by itself will reduce energy consumption. I will disagree. Let me first state, I am not funded for this analysis, therefore I can only delve so much into this – though if someone would like to fund me I would be glad to be more thorough – but I believe the charts and the data I have put together should bring some doubt to the CO2 Scorecard claims. First I will address my greatest pet peeve from the champions of efficiency – using California as the example for the rest of the country. There is a reason California is the most populated state and it’s not because of the local government, taxes, and friendly people – it’s the weather in concert with its natural beauties (beaches, forest, etc…). The term Sunny California is not even close to the saying Sunny Texas. Overall the winters are mild compared to Ohio and the summers are mild compared to Texas. The primal use of energy is for climate control from the extremes and for cooking. With California not observing any extreme temperatures, it should be no surprise; they are the least energy intensive state.
CO2 Scorecard shows the following graph in their report to support their claim that efficiency programs can have significant impact on energy use. Once again, I will agree that efficiency program can have micro impacts by themselves, but do not have significant sustainability for a macro reduction of energy without other factors such as price.
Let me present some charts that the CO2 Scorecard folks could have easily added into their analysis, if they truly wanted to be empirical.
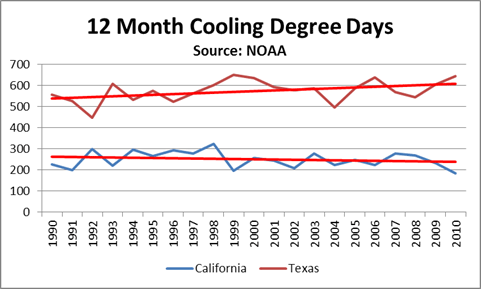
Cooling degree days represents the days above 65 degrees Fahrenheit. The data can be obtained from the National Oceanic Atmospheric Administration (NOAA) who manages the National Climatic Data Center. If you plan to use their data be aware of each of the drop downs and the meanings. The cooling degree chart actually does show a warming trend for Texas for the last twenty years, whereas California has been showing a cooling trend. This is skewing the chart CO2 Scorecard presented. Each Texan had to use more electricity to maintain the corresponding comfort from last year, whereas Californians improved their energy use as the weather only got better – life is unfair.
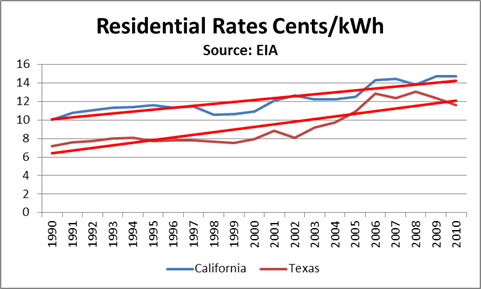
Another chart accessible to CO2 Scorecard, which they failed to delve into, is the Residential retail price trend. Price is the missing piece in many efficiency discussions. Real sustained energy reduction can be obtained with the combination of efficiency and price increases.
Texas was catching up to California, but this will not likely occur as natural gas prices have fallen. California’s sustained higher prices have resulted in greater incentives for Californians to save each kWh.
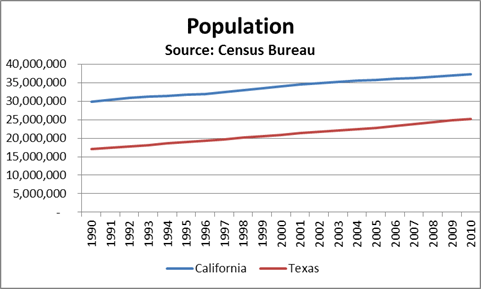
Population trend was also an important element in producing the digression in energy use per capita.
Texas was growing twice as fast as California for over the last 20 years. My northern friends set their summer thermostats between 68-72 whereas my Texas natives live with 78-80. Clearly a subset of the growing population in Texas was going to use more energy.
Micro vs. Macro and a Question of Morality
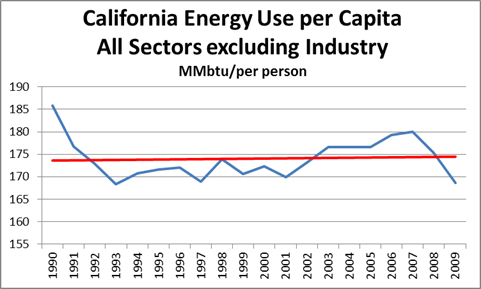
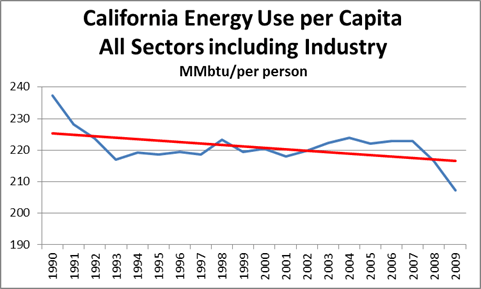
I think both the CO2 Scorecard and BTI mixed up micro elements with macro discussion of energy reduction. I will use the California case to prove my point. As Californian’s reduced their use in Electricity in the residential sector, this enabled the Californians to re-allocate their capital for more consumption elsewhere. This is the nature of our economy – consumerism. This can be seen in the form of driving more, shopping more, and/or living with more things. The chart below presents this to be true:
The positive note is the consumption trend line is quite flat, but this is likely due to the cost of living in California and the exporting of energy use (later discussed). I have excluded industrials because of the national and local trend to push manufacturing away. If I put it back into the chart, the amazing efficiency trends re-appear.
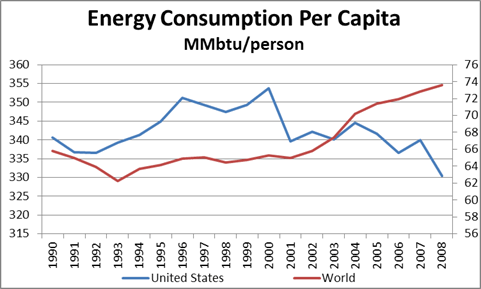
The efficiency trend with industrial is evidence of the micro vs. macro trend. Energy is a global demand as we each strive to live better. Resources making energy is in demand worldwide. If we use less, most likely others would benefit from our reduction in the demand pressure on that resource. At the same time, we cannot take credit for a reduction of energy when we have decided others to make our widgets and we only track the energy consumption of using the widgets versus the energy cost of making the widgets.
The above chart shows the manufacturing shift and also the electrification of people who have no access to electricity. For us in the western world it is almost impossible to imagine not having access to electricity. Yet, 1.4 billion people in the world still do not have electricity. This is 1 in 5 people in the world without electricity.
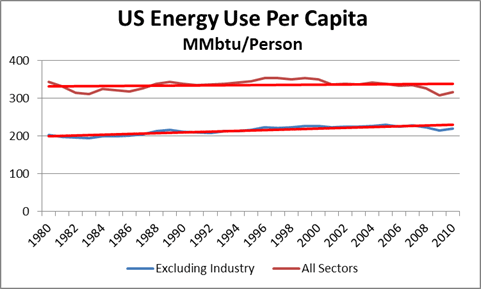
Even in a micro view of only the US, there is evidence the shift of California energy use was partially shifted to other states in the US.
The trend line in energy use is still climbing for both lines, less so with all sectors included. We are still increasing our energy even though we have become more efficient.
I see a large value in efficiency improvements, but it is not on the basis of reducing energy. It is on the basis of freeing capital to allow other forms of investment in matters not focused on the means, but the ends. We can see this has happened by what CO2 Scorecard emphasized, the falling use of energy for refrigeration in households. In fact, residential use of total electric consumption from refrigeration, space cooling, space heating, water heating, freezers, cooking, and indoor lighting now represents only half of the energy consumption as compared to 1980 when those categories represented 90% total residential electric consumption. Some of us now use more energy on our widgets than our essentials and our ability to do this can largely be attributed to several efficiency programs. On a moral basis, we have helped the rest of the world to more easily obtain the use and value of energy by being more energy efficient. It is almost a mass balance. We will use resources or someone else will, unless there are price drivers preventing the pursuit of living better.
Another moral question we need to balance locally, efficiency programs are regressive in nature. As an example, a subsidy from the utility to insulate housing must be paid for by the rate payers. A subsidy typically means a partial payment. Those who likely have free capital to spend – versus living paycheck to paycheck – are more affluent. The affluent will likely take advantage of the subsidy. The utility rates in the near term will rise from the subsidy itself and also the reduction of energy since the utility model is designed to recover cost. If the system uses less energy the utility must charge more per energy use to be whole. Those who do not take advantage of the subsidy will be impacted twice as much.
As with many issues in the energy industry, things are not black and white. However, if we maintain an open-mind to learn and change our views, we can learn to progress and make better decisions. I am open for criticism for my analysis. Given my time commitment and lack of funding, I certainly could have overlooked a few critical items. My point in writing this is not to produce a conclusive report on this subject, but to point out some critical elements I see missing in the various discussions on efficiency. This writing should not leave anyone to decide to be against efficiency, but to understand the value of efficiency and to help accurately color the discussion on the various efficiency programs.
If you like this type of analysis, please consider funding studies for me to do or hiring me as consultant.
We positively and evocatively challenge the current thinking involving any aspect of energy use. We look for projects that offer meaningful, transformative, with impactful outcome to the marketplace or society (see projects).
Please consider All Energy Consulting for your consulting needs.
Your Energy Consultant,
David K. Bellman [email protected] 614-356-0484


