#3 Clean Power Plan Assessment
Let me note a couple points of reflections from my last review of the Clean Power Plan before I proceed with the next portion of the plan. The choices made by human civilization over time typically revolved around resources. Certain groups became experts at their region and learned how to extract and use their resources (e.g. Coastline habitats typically became expert fisherman and trades people). The US unlike many other nations is a large conglomerate of vast and different regions. For the most part, the US respected the states’ rights, and each state grew to maximize their resources without much force to do it one cerain way. Renewable generation is not a universal accessible. There are regions that clearly will have better performance in certain renewable generation (e.g. Solar – Arizona, Wind – West Texas, etc…). The EPA tried to balance that by using the state RPS programs. However, the state RPS programs became a political tool rather rooted in economics and science. To substantiate that point, many RPS programs offer an escape clause (e.g. Alternative Compliance Payment) so the politicians can take credit for promoting without having necessarily to commit. This made it much easier for some to pick catch phrase policy such as 20 by 20 (20% renewable by 2020).
To have solar mandates greater than states such as Arizona, in the end, offers a huge subsidy to those states with high solar intensity. Natural economic evolution would produce solar cost savings and technology improvements driven from states such as Arizona, which would then roll those gains into less sunny states. Arizona 2012 average retail rate ranks 19 out of the 50 states at 9.71 cents/kWh. The top state is Hawaii – another very sunny state who is limited in resources and whose rate averages 31.59 cents/kWh. If solar was so easy and economical, these states would be far ahead of their current levels – Hawaii less than 0.5% and Arizona slightly under 2% as percentage of total energy in 2013. Obviously, there are some economic advantages of being able to build and design effective solar technology to export to areas of need. To extract this value, it does not necessarily require the host state to have policies exceeding other states. A difference of 10% capacity factor (12% to 22%) can produce a swing of over 10 cents/kWh. I mentioned all this to point out the concern that EPA used the state RPS program as their guide to the level of renewable. However the economics and science to these RPS programs may not be reality, as politics can defy reality.
The final recommended Best System of Emission Reduction (BSER) from the EPA in the Clean Power Plan is “4. Reducing emissions from affected EGUs in the amount that results from the use of demand-side energy efficiency that reduces the amount of generation required.” This is the 3rd most impactful out of the 4 programs in terms of reducing CO2 rates.
I have worked and reviewed many demand-side energy efficiency programs. I had the opportunity to work with the Northwest Power and Conservation Council (NWPCC) and review their data, which is impressive. Demand-side energy efficiency programs should be evaluated as a resource. I have helped many utilities in enabling their power models to do this. Unlike the other 3 BSER, this one is very dependent on human behavior, and because of that, much more detail and thought needs to be examined. EPA did not go into detail. “We have not assumed any particular type of demand-side energy efficiency policy.”
The issue with demand-side energy efficiency program can be summed up with EPA’s own words “Regardless of how the energy savings of an energy efficiency measure are determined, all energy savings values are estimates of savings and not directly measured” EPA spent much time talking about evaluation, measurement, and verification (EM&V) industry given the reliance on estimates. The problem I have noticed here is we have an industry that has grown significantly from $1.6 billion in 2006 to $5.9 billion in 2011 and projected to be over $8 billion per the American Council for an Energy-Efficient Economy. As with all industry that grows that quickly there will be growing pains. The first one that comes to mind is that there are certain companies who are in all three spaces, Evaluation, Measurement, and Verification. You can see there are many companies who evaluate in one state and verify in another. This should be unacceptable practice and the commissions need better oversight of these companies. Too many incentives exist to support the ever growing DSM-EE industrial complex regardless of actual results when this happens. It is important that there are checks and balances in the EMV space to minimize these practices.
The goals set forth by EPA are done so by assuming a best practice standard for each state and then targeting that rate. “For the best practices scenario, we have therefore estimated that each state’s annual incremental savings rate increases from its 2012 annual saving rate to a rate of 1.5 percent over a period of years starting in 2017.” I am sure this is conservative for many states, but at the same time I expect just as many, if not more states, to have a much harder time hitting target. Based on their spreadsheet, by 2030, demand-side energy efficiency programs will total 380,569,493 MWh. To put that number in perspective, this is more energy used by the state of Texas, state of California, or the United Kingdom. Using the average retail rate of electricity of 9.9 cents/kWh – this would amount to over $38 billion dollars a year “wasted” by society. It is an astronomical number to imagine that society would be that inefficient on a business as usual path.
It is true, that as whole, there are energy savings that an individual consumer could not realize or value without a collective saving mechanism. The difference can typically be traced down to the value of capital and the fact that a personal decision is not always economically rationale as other factors such as feeling good, to peer pressure, are very hard to economically quantify. In these cases, programs can be developed to add more value to savings to even nudging the consumer to act good for the whole.
The extrapolation from one state to another state needs to be carefully balanced given the human connection to these programs. As I noted before, DSM is a detailed process since it focuses in on what your customer uses energy for. If your customer uses heat pumps to stay warm as their primary energy usage, implementing a large light bulb program will only get you so far compare to places like California. As weather becomes more temperate, it is easier to modify behavior since human life is not harmed. However in extreme cold or heat, energy efficiency becomes limited. The successful California experience in energy efficiency just cannot be extrapolated one for one to other states.
Programs do naturally have a natural end life. As a simple example, consider the conversion of lighting. It eventually ends. In fact, the big gains end quite soon, as you think about where and how you use lighting. Eventually the incremental lighting updates occur in less used areas such as garages to closets. The initial lighting change will be in the most used area, but the incremental change much less so. An extrapolation of those impacts needs to be carefully considered. Many EMV companies understand this so it is worrisome to extrapolate savings for so many years.
Let me pause here before I go into a can of worms in dealing with cost and benefit.
If you need help in designing and modeling your DSM programs I can help you. In addition if you need a third party to help discuss with regulators and commission your decision criteria for DSM, I can also assist in this.
Policy discussions can be beneficial when coming from a factual context without significant biases or agenda. There is no doubt in my mind policy can be an effective tool in producing positive societal benefits – it is all in the design, implementation, and regulation.
Please contact us 614-356-0484 or[email protected]
Your Inspired Energy Consultant,
David
Founder & Principal
All Energy Consulting LLC
“Independent analysis and opinions without a bias.”
614-356-0484
[email protected]
blog: https://allenergyconsulting.com/blog/category/market-insights/
#2 Clean Power Plan Assessment – Market & Engineering Perspective
Before I continue with my assessment of the Clean Power Plan, I want to reflect and comment on what I have discussed in the first post. Let me make this clear, there is NO congressional action needed to make this happen. This is all being done through the Clean Air Act.
The fact that EPA is using a rate based mechanism does not preclude it from hitting a ton reduction given this is being applied to the existing fleet. Plus, they are limiting the new plant options. The only way to exceed the tonnage barrier is to add to the denominator of the rate (lb/MWh). Energy efficiency programs (EE) and renewables can be counted to the MWh. The limits they proposed from their Excel spreadsheet are based on very aggressive and large reduction-given they are starting with the 2012 lowest gas to coal price spread. (as noted in the previous discussion) Then, they modify the coal to be more efficient plus re-dispatch more gas and then adding Nuclear, Renewable, and EE/DSM efforts to the denominator to produce state by state CO2 rate lb/MWh. Because this calculation is only on existing units, it is not likely to be able to increase significant volume of CO2 from those plants as some discuss. The rate will be highly dependent on being able to achieve and/or over achieve the Nuclear, Renewable, and DSM/EE efforts as they calculated. This leaves room for total tons of the entire fleet (new and old) to be greater, but this will not come from the existing fleet. Also, given the renewable and DSM are quite high targets, the tonnage level will not likely exceed to what they are targeting-which is “Nationwide, by 2030, this rule would achieve CO2 emission reductions from the power sector of approximately 30 percent from CO2 emission levels in 2005.”
This is a perfect transition to continue with the assessment of the Clean Power Plan. The next BSER and the most impactful block is “Reducing emissions from affected EGUs in the amount that results from substituting generation at those EGUs with expanded low- or zero-carbon generation.”
In this section, they discussed the role of nuclear. This is the smallest impact, even less than the coal unit efficiency improvement. Adding CO2 cost will likely keep many of the nuclear fleet from retiring. The re-license cost has grown for nuclear fleet given all the recent issues with nuclear. Some estimates show cost to re-license greater than 4X the cost of a brand new gas plant. Given the limited impact of nuclear, I will limit the discussion and move on to the largest piece of the puzzle, Renewable.
EPA is focused on wind and solar renewable. They note they left out biomass. The renewable piece is a tale of two calculations. The effects of the option 1 BSER, according to the EPA IPM results, are minimal on the actual renewable capacity. Less than 10% change in capacity was observed from the base to option 1. Producing a CO2 price should certainly incentivize more renewable and nuclear generation. On an annualized basis, non-hydro renewable generation is growing 2% a year. This certainly seems to be reasonable-if not conservative-given the last ten years has seen double digit growth in renewable generation. However, there is a big difference in the IPM file and the Excel spreadsheet. In the Excel spreadsheet, renewable generation is shown as almost 50% higher than the IPM option1 case. I am not sure what to make of the difference. In the spreadsheet case, it is still not unreasonable to assume a 4% growth in renewable generation in a year. This would require artificial support which could be in the form of Renewable Energy Credits (REC), CO2 price, and/or tax credits. In terms of incremental cost over the IPM model, if we assume the difference in MWh, the associated capacity factor of 0.3, and the capital cost for renewable of ~$2000/kW this calculates 63 GW at cost of $127 Billion.
My concern is more in the distribution of the renewable versus the total. EPA initially examined the renewable potential by 6 regions. In their own words: “EPA estimated the aggregate target level of RE generation in each of the six regions assuming that all states within each region can achieve the RE performance represented by an average of RPS requirements in states within that region that have adopted such requirements. For this purpose, EPA averaged the existing RPS percentage requirements that will be applicable in 2020 and multiplied that average percentage by the total 2012 generation for the region. We also computed each state’s maximum RE generation target in the best practices scenario as its own 2012 generation multiplied by that average percentage. (For some states that already have RPS requirements in place, these amounts are less than their RPS targets for 2030.) For each region we then computed the regional growth factor necessary to increase regional RE generation from the regional starting level to the regional target through investment in new RE capacity, assuming that the new investment begins in 2017, the year following the initial state plan submission deadline,153 and continues through 2029. This regional growth factor is the growth factor used for each state in that region to develop the best practices scenario. Finally, we developed the annual RE generation levels for each state. To do this, we applied the appropriate regional growth factor to that state’s initial RE generation level, starting in 2017, but stopping at the point when additional growth would cause total RE generation for the state to exceed the state’s maximum RE generation target.”
This all makes sense until you think about the market perspective and the actual reality of this approach. Historically, the areas with the greatest renewable development generally have two characteristics – high power price and/or an abundance renewable generation opportunity. The barrier to jump to alternative power source was minimal, such as the case in California compared to states with low power prices Kentucky and West Virginia. These states with much lower prices will have a greater impact in moving to a more renewable system. Their economy is not centered on high power prices. The jump to this higher value will be significant. West Virginia growth in renewable is 1000+%. In West Virginia’s case, EPA is asking the state to invest in a more expensive, but cleaner power source. If we assume the same assumption above, then WV’s needs ~3.6 GW of wind capacity with a total cost of $7 billion dollars. If we spread the cost with West Virginia retail sales over the next 20 years it would still cause a rate impact of 14%. I did a state by state analysis on this renewable piece – if you are interested email me[email protected]
Let me pause here for further digestion before moving onto the EE/DSM portion of the plan.
We can help the policy discussion in terms of running independent assessment and helping develop strategies to best plan for the future.
Please contact us 614-356-0484 or[email protected]
Your Inspired Energy Consultant,
David
Founder & Principal
All Energy Consulting LLC
“Independent analysis and opinions without a bias.”
614-356-0484
[email protected]
blog: https://allenergyconsulting.com/blog/category/market-insights/
Clean Power Plan Assessment from a Market and Engineering Perspective
There are many reviewing the recent EPA – Clean Power Plan. Many argue from a policy perspective and rarely actually review the details and the numerical results. In this discussion, I will share with you my initial takeaway from reading the 645 Clean Power Plan along with hundreds of other pages in the Technical Source Document (TSD) plus the Excel files supplied. In addition, I did use my Power Market Analysis (PMA) model to validate and cross check some of the results.
Let me first give some background to those who do not know me. I am a Chemical Engineer from the University of Texas at Austin (hook’em horns) by training, however I have spent most of my professional life in analyzing and understanding energy markets (Purvin & Gertz (now IHS), Deloitte Consulting, American Electric Power). Please don’t hold the American Electric Power experience as a foretold bias on coal. I have served on the National Renewable Energy Laboratory (NREL) technical advisory panel so I do know the issues and trends of renewable power. My fellow panel members would vouch for my impartial attitude. I am a numbers person who holds not personal bias other than the desire to optimize the numbers. Truth be told, I was a leader in the AEP organization in terms of indicating the need to diversify and support gas investments even as gas markets were soaring, as my groups long-term forecast indicated prices to settle between $5-7/mmbtu for my entire tenure at AEP (2002-2010), to the angst of many AEP colleagues. My forecasts are not driven by personal biases or political motivation, but the desire to understand and know the markets. I live by the University of Texas motto “The Truth shall set you free”.
I have approached the Clean Power Plan Assessment in a similar fashion. I am opened minded on the need and societal desires to be cleaner. Striving to have a positive or the least negative impact on the earth will always be a good intention. As long as people are clear on the cost and potential gains, I would not challenge the path society has chosen.
There is so much one can note on a 645 page plan. The document was repetitive in several places – the ironic thing is on page 581 there is a note on the Paperwork Reduction Act. I was taking my own notes as I read the document. My notes ended at 17 pages. I have reorganized my thoughts to hit the most impactful points first.
I think the very first thought that should rush into everyone minds is the rate focus EPA has. The EPA, compared to many of the previous emission reduction goals, is now pushing a rate based target (lb/MWh) vs. a tonnage limit as seen in SO2, NOx, and even the initial HG program. They do offer the option of mass based target, but clearly favor the rate based approach. This took many nights to truly understand and absorb all the nuances as to why this is the case. The first thing in order to understand this approach is to understand the rule is focused on EXISTING units and those recently under constructed. This is a key issue on why the buildings of new gas plants are not listed as an option for Best System of Emission Reduction (BSER). Currently the new gas plants will likely be limited by section 111(b) of the Clean Air Act (CAA). “In January 2014, under the authority of CAA section 111(b), the EPA proposed standards for emissions of CO2 from newly constructed fossil fuel-fired electric steam generating units (utility boilers and integrated gasification combined cycle [IGCC] units) and for natural gas-fired stationary combustion turbines.” The limits proposed for new gas plants would be an achievable solution for 24 states. The other states will have to go lower than gas plants. For this reason, I suspect the gas plants were not a BSER solution nor were they discussed for more than a few paragraphs.
The rate method also allows an “easy” way to give value and credit to EE and renewable projects. There seems to be some conflict in allowing this given the plan currently notes: “Based on the EPA’s application of the BSER to each state, the EPA is proposing to establish, as part of the emission guidelines, state-specific goals,expressed as average emission rates for fossil fuel-fired EGUs.” However by allowing EE and Renewables to modify the rate calculation, it seems to have conflicted with the above statement. The argument is made that EE and renewable generation can be attributed to the affected EGU. “A MWh crediting or adjustment approach implicitly assumes that the avoided CO2 emissions come directly from the particular affected EGU (or group of EGUs) to which the credits are applied”
EPA spent much time focused on their BSER suggestions laid out in four blocks:
“1. Reducing the carbon intensity of generation at individual affected EGUs through heat rate improvements.
2. Reducing emissions from the most carbon-intensive affected EGUs in the amount that results from substituting generation at those EGUs with generation from less carbon-intensive affected EGUs (including NGCC units under construction).
3. Reducing emissions from affected EGUs in the amount that results from substituting generation at those EGUs with expanded low- or zero-carbon generation.
4. Reducing emissions from affected EGUs in the amount that results from the use of demand-side energy efficiency that reduces the amount of generation required.
Based on that evaluation, the EPA proposes that the combination of all four building blocks is the BSER”
The EPA first BSER seems to be somewhat of a red herring. They spent quite some effort only to conclude a small impact. I oversaw a paper on power plant efficiency for the National Petroleum Council Hard Truths. A very similar conclusion is shown in that only a few percentages are likely to come from an existing unit improvement. This impact is the smallest by many percentages compared to blocks 2-4. I do have concerns in their extrapolation for opportunities for improvement in the existing US coal fleet. In their spreadsheet model, they take 2012 generation and assume a 6% improvement. The issue I quickly see with this math is the fact the likely remaining coal units that are running after 2020+ are likely the best of the best coal units to begin with. These coal units did not get to be the best ignoring best practices, therefore the remaining coal units will have much less opportunity to improve heat rates compared to the units that will likely be retiring (From EPA own analysis 72 GW 2016 to 101 GW by 2030 (cumulative)).
The second block is the most interesting block in my mind. It is also the second most impactful of the blocks only few percentages away from #3. When dispatched is discussed, one should quickly jump to market conditions. A dispatch of power plants is largely driven by load and fuel commodity price relationships. The first issue, largely perhaps by coincidence and unintentional is their use of 2012 data. Out of all the years one could choose, 2012 is probably the LEAST likely year in the future in terms of commodity price relationships. The spread between coal and gas prices was less than $0.40/mmbtu. Nowhere in the forecast is this price spread being predicted. In the models being used, the spread is closer to $3/mmbtu. This produces an abnormal level of coal generation to start their calculation of targeted rate. In order to get gas units to perform in the 70% utilization range, retirement of existing coal unit and/or the spread of the fuel cost need to narrow. Using a carbon cost will narrow the economics. I did run a 2016 carbon case with $30/ton, and it did produce NGCC utilization rates close to 70%. Therefore there is an agreement with the statement “For the scenario reflecting a 70 percent NGCC utilization rate, comparison to the business-as-usual case indicates that the average cost of the CO2 reductions achieved over the 2020-2029 period was $30 per metric ton of CO2”. What I will be concerned with is the statement “Projected wholesale electricity price increases over the same period were less than seven percent in both cases, which similarly is well within the range of historical electric price variability” I think they are referring to the gas price change impact due to more demand. However the question really should be the impact of making the gas units 70% utilized which is done by adding the $30/ton carbon cost. The 7% increase would seem very unreal with the math of only dispatching difference and carbon of $30/ton. When I model 2016 with and without $30/ton carbon, it results in significant price increases. PJM-West prices rise 50%. In terms of total system impact, the 2016 case without carbon is showing total US energy revenue for all the plants of $168 Billion. Adding carbon increases the energy revenue to $253 Billion, an increase of 51%. It is possible to lower the cost as certain markets are closed system and may not pass the cost directly to the consumer. However, market principle for the majority markets would apply and this is increasing as more utilities de-regulate their generation. Another potential for price increase mitigation could be if they model more than block 2 and included renewables. Renewable PPA deals do collapse the wholesale market, but those cost show up on the retail prices. However they discussed this in the block 2 discussion. There are regions where prices move up only 17%, but, on average, prices are up 50%. This brings up another can of worms in terms of state impacts from one to another. Out of the hub reporting I am looking at, Indiana will be the biggest hit. I am at loss to understand the minimal discussion of energy price impact of $30/ton carbon cost. A true impact study should show the case where coal units are running and then adding carbon cost to essentially push out coal units should be the comparison. They do note the multi-pollutant benefits, counter to that they should also identify the multi-pollutant cost by modeling a business as usual case (no MATS, CSAPR, CPP, etc…).
There is much to digest here so I will pause before discussing blocks 3 & 4.
We can help the policy discussion in terms of running independent assessment and help develop strategies to best plan for the future. Please contact us 614-356-0484 or [email protected]
Your Inspired Energy Consultant,
David
Founder & Principal
All Energy Consulting LLC
“Independent analysis and opinions without a bias.”
614-356-0484
[email protected]
blog: https://allenergyconsulting.com/blog/category/market-insights/
Summer 2014 Outlook – Power, Gas, Coal, and Generation Fleets!
Over 90 graphs and 79 pages of hard-hitting analysis. This report does not regurgitate what you already know. Executive summary along with some graphs are presented below.
Though the report is 79 pages, it is still only a small fraction of what we could present. We are able to build off this analysis to produce any custom view or further analysis that is directly your concern. The power markets touch many, from traders, energy managers, fuel buyers, plant operators, government officials to fuel producers and many more. We have the ability to help you better understand the market by explaining what has happened and how the future can unfold and what you can do to prepare for that future.
The report is free to PMA Prime Members. Power Market Analysis (PMA) is a compelling product that provides subscribers a dynamic new approach to interpreting and explaining market fundamentals affecting North America’s power markets and their impact on the coal and gas industry. PMA Prime members can expect to get 4 quality in-depth reports a year along with other smaller insight reports each month. As an introductory price we are offering the report for $10K or $5K for one section.
A free version is available. Given our introduction into the market, the difference in the free version is limited. Free version is lower resolution and some parts are redacted.
Thoroughly analyzing the power markets can offer something for everyone given how much power touches everyone’s life. As demonstration of breadth, in the Summer 2014 report, we created a company fleet view. This would add valuable insights to investors in the utility industry.
Your Inspired Energy Consultant,
David
David K. Bellman
Founder & Principal
All Energy Consulting LLC
“Independent analysis and opinions without a bias.”
614-356-0484
[email protected]
blog: https://allenergyconsulting.com/blog/category/market-insights/
Executive Summary
Summer of 2014 will differ from previous years as a result of one of the coldest winters in decades. The weather will continue to play a key role in how the summer unfolds. An in-depth and rigorous analysis is done on fuel consumption, power prices, and the top 10 utilities generation fleet. Power Market Analysis (PMA) processed 19 different potential sensitivities that could impact the power markets and presents key findings from those runs.
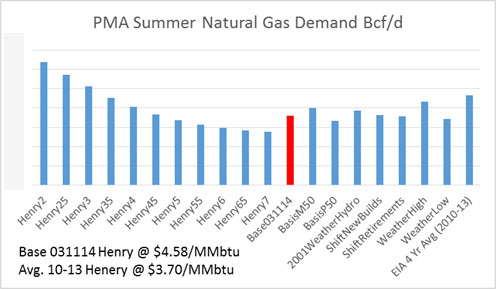
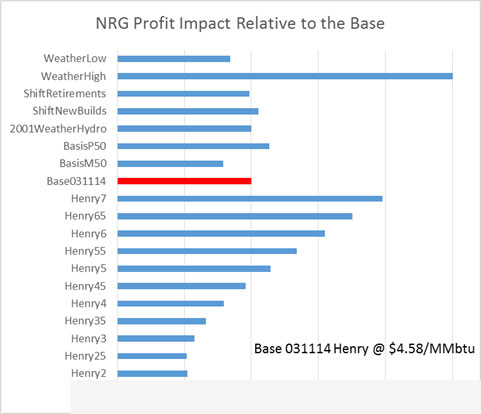
Gas demand is the most sensitive variable being easily impacted by elements such as changing commodity prices to weather. With the current forward curve of Henry Hub, prices this year will increase +23%, relative to 2013. This price change will significantly reduce gas demand in the power sector, assuming normal weather. Coincidently, the base case is showing a 23% drop in summer power gas demand compared to the four year average. The recent EIA Short Term Energy Outlook (STEO) is not anticipating much drop in power demand in 2014 relative to 2013. In order for that to happen, there are several changes in key variables needed, in some cases by themselves or in combination with other variables, to mitigate the gas demand drop in the power sector compared to 2013. An unusually warm span of weather can make up for the drop in gas, but this would have to be even warmer than the record setting summers of recent. The Western drought could impact the gas demand in the sector by almost 7% if the drought was similar to that in 2001. A price drop of almost $1/MMbtu could produce no drop in demand from the power sector. In addition, a further decline in negative basis could also add to gas demand. All this is displayed in the analysis below.
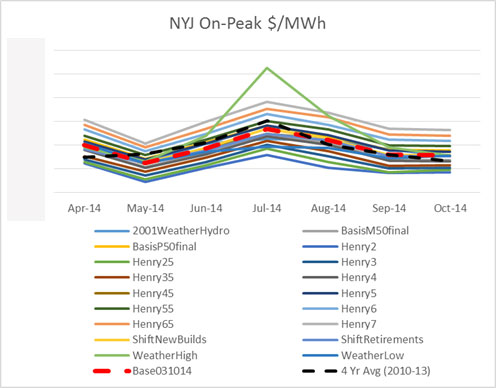
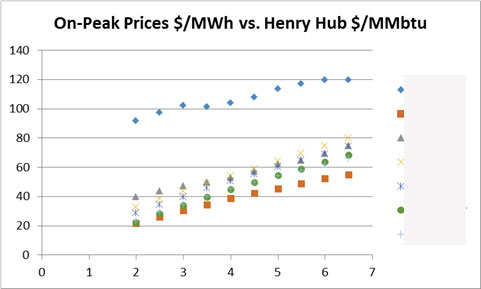
Power prices across the US will perform differently depending on the existing infrastructure and current generation fleet. There are areas which are very sensitive and can easily experience significant prices spikes – NY and ERCOT. Many areas are directly tied to natural gas prices. Other areas are showing little impact to power prices even if gas prices were to fall. There are usually trading arbitrages in power markets as the ability for the market to efficiently compute all possible changes is limited. Power market analysis requires a platitude of skill sets which then must be combined and deciphered to produce a cohesive picture. Many times, by the time the process is complete, the market has moved on. PMA subscribers get fresh daily runs, so whenever the market shifts, PMA is there with a snapshot of possible scenarios. The various power markets have their own characteristics. This can be seen in the analysis below.
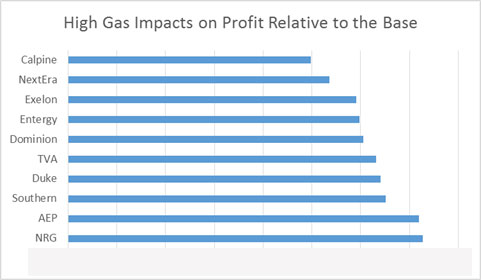
The top ten utilities fleet, by size of generation capacity, was reviewed under the various 19 cases. A proxy calculation was made on how the fleet could be impacted from the base case. Some fleets were much less risk averse to changes in the market. Whereas others could see a devastating profitability change if certain sensitivities come to fruition. All fleets would like to see a warmer than usual summer, but NRG and Calpine fleet can hit the lottery if this were to happen. There are many business strategies that can be designed once the knowledge is made on what makes the fleet “tick”. More company fleets are available upon request.
The Summer 2014 PMA analysis demonstrates the vastness of analytical capability and information available if power market analysis is well thought out and performed. PMA is designed for flexibility to offer multi-faceted views of the power market. There is so much more available in terms of reporting. If you would like additional information from these runs please contact us at [email protected] or at 614-356-0484. Also customized cases can be done for a fee.
Sample Figures:
Refining Outlook Refined for 2014
As I review my last year’s thoughts on refining with updated data, it has caused me to be more bullish on the outlook for refining – which historically is very hard to do. US refining may be entering another golden age – or perhaps it never left, but just took a nap. There will be refiners who benefit more than others. However, the overall market should see additional boost.
What is new or more reaffirming from last year’s review:
- Continued liquids production from the shale plays.
- Crude imports are coming whether we like it or not by rail or by pipeline.
- Continued growth in developing countries.
Shale Play
Shale production continues to beat expectations. I researched over a dozen papers reviewing and analyzing shale decline curves and initial production rates. The amazing outcome is not the technology acceleration, but the ability to learn to use and adapt existing technology is accelerating. Each shale play is unique with an initial set of known. Applying the techniques done in one play to another play generally does not optimize the production. The ability to be creative with the tools and resources available has clearly shown an increase in production. Data is available showing initial production rates to decline curves are improving at wells within existing plays. In addition, the newer plays are seeing even a more accelerated path of improvements than the Bakken.
It is our belief, this will continue leading to more oil production in the US. And this oil production is of the sweet and light crude oil. This very fact is causing the US producers to want to lift the ban on exporting crude oil from the US. As discussed in my previous refining outlook discussion, the US refiners outsmarted themselves and built the wrong refining configuration. All is not lost; they just don’t value the sweet crude as much as the outside world might. At some discount, the oil will be processed and changes will be made in the US refining complex. This discount is driving producers mad and so the hope is with the ability to export. They could find better buyers across the ocean. In the meantime, without the lift in crude oil exports, we should continue to see a feedstock price discount to several refiners. This will cause a drop in finished product prices in the US for the consumer. However, I anticipate the drop in finished product prices to not be as low as the drop in feedstock prices given the export outlet for finished products.
Crude Imports
Crude imports are coming no matter what you are hearing about the Keystone pipeline issue. The Keystone pipeline encompasses a greater plan which is shown on this website. The project is actually three parts with 2 of three pushing forward as the main Keystone Pipeline still is being debated. Right now, we have 180,000 barrels/day of crude oil moving by rail from Canada to the US. The debate perhaps is really the rail industry supporting the ban on Keystone, because the oil will come, it’s really just how you want it to come here, assuming we still want to maintain free trade with our Canadian friends. This crude oil is more to the liking of the US refining sector. I suspect logic will prevail and the pipeline will move forward and pressure on the US crude oil markets relative to the foreign markets will maintain itself. The forward curve as of 02/06/14 continues to show a very stout spread between Brent – WTI of $14/bbl. Overtime, I suspect that to come back down to perhaps the $5/bbl range. However, I think gone is the convention that on annual basis they will trade in parity.
Non-OECD Oil Demand Growth
Over the last 8 years the OECD region demand dropped nearly 5 million b/d. The US represented nearly half of this drop with half of that drop coming from the push on alternatives fuels mainly ethanol. Ethanol production now stands at 0.9 million b/d. Biodiesel adds another 0.1 million b/d. Even though much is talked about renewable in the power space that there is now significant volumes to be discusses in the petroleum space. As I indicated in the power space reaching a peak consumption one can conclude the same in the oil space for US consumers.
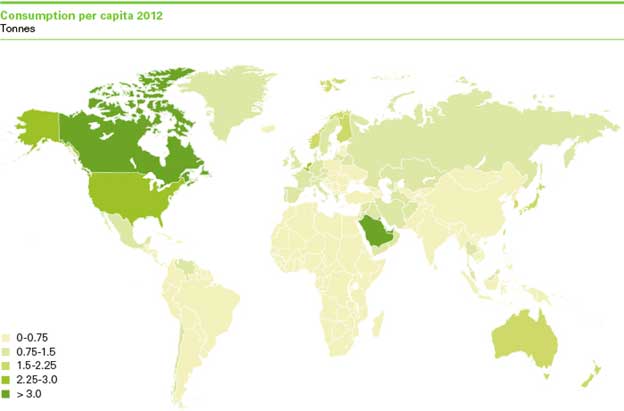
With the entire demand decline in OECD region, one would think prices should have declined versus rising 70% in the US gasoline markets. However, Non-OECD demand grew 9.7 million b/d over that same time period OECD was declining. There is so much more room to grow for non-OECD region. BP shows a graphical view of oil consumption per capita across the world. Even though the US observed a great drop in demand there is still a large gap between the US and the majority of the world.
With those three outlooks solidified, I am optimistic on US refining. Within the sector, there will be winners and losers. I can help the refining sector by offering crude oil evaluation to strategic planning to optimize the above concerns. A fundamental view of crude oil prices and refined products are available.
By the way I do have an opportunity for those interested in a 80,000 bpd condensate refinery in the Caribbean. A detailed cost study along with an economic analysis was done showing an investment need of around $600 million producing 20+% IRR. To build a brand new refinery of this scale would be around $1.2-$1.8 Billion. Please contact me if there is interest in this investment.
Your Continually Refining Energy Consultant,
Peak Energy – Are we there in the US?
Peak energy can be related to many things from Peak Demand, Peak Oil, etc… Let me clarify my discussion. Peak energy in my context is the electric energy being consumed by the end user each hour and averaged. Therefore, the unit of peak energy is Megawatt Average (MWa). This is much different than the peak demand Megawatt (MW) which occurs in one hour.
I am writing about this topic as I have just analyzed 118 Load Zones across the N. American continent. Statistical analysis was done on those areas incorporating 26 variables, which included 9 weather zones (CDD & HDD) and 8 economic regions starting with data back to 2009. This was an arduous and complex task as each individual zone needed its own menu of variables to optimize the analysis. AEC is about to launch a new online product – Power Market Analysis (PMA). PMA will be an online product with annual subscription access to power prices projections across the country and fuel consumption forecast of coal and gas in the power sector for the next two years – More information on PMA to come. Load represents a fundamental input in analyzing the power markets, so the task had to be done.
The results of the analysis are very eye opening. The R squared (indication of how well data points fits to the variables analyzed with – ranges from 0 to 1, poor to perfect fit) across all 118 load zones averaged 0.92. There were several regions which have now begun to decouple from GDP. The economic well-being of several regions is no longer driving the growth of power. At this point, I can hear grumblings and concerns at investor held utilities since the load growth is the main mechanism on shareholder returns. Don’t stop reading, it’s not all gloom or doom for all utilities. There are two main reasons for this decoupling of GDP. First is the increase spending in Demand Side Management programs across the country to a tune of $9 Billion. Second, we may have reached a peak point in energy consumption per capita. As you look around, how many more devices can you obtain? Each new device is incorporating better and improved efficiency. At some point, we will hit a limit to the energy consumption each of us can do. We are clearly seeing this in this analysis in certain large metropolitan areas when you strip out the weather component. However. I am only seeing this in certain regions.
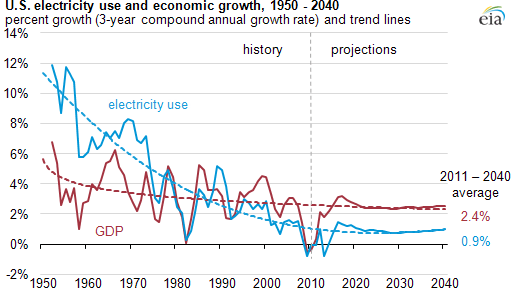
The EIA put out a briefing on March 22, 2013 alluding to this. The graph below does not seem to be weather normalized. This can lead to a skew vision of what has gone on recently.
Weather has been a large factor over the recent years. If you look at the GDP from 2010 to 2013 the growth is close to 4%/yr. If you look at electricity consumption without normalized weather the picture will show an annual decline of 1%/yr. However, if you strip out the weather component, the load growth is closer to 2.3%/yr. 2010 was an extremely warm year with cooling degree days across the country 21% greater than a normal year.
Weather variations will lead to consumption change as we have become quite temperate in our ability to adapt to various climates. The weather piece will need to be stripped out of the discussion when it concerns understanding the relationship between power consumption and the economy. Peak energy discussions cannot include a conclusion on the basis of extreme weather events. Based on our analysis we still project a rather robust growth in power consumption of 1.9%/yr for N. America based on normal weather and GDP growth around 3%. Areas that are seeing significant growth are related to the Oil & Gas areas such as Texas, Alberta, Louisiana, and even pockets in the Midwest with shale development.
PMA will offer a daily view of the next two years with three different scenarios – base, high power price, and low power price. The changes between the cases will be weather, GDP, and gas prices. In addition subscribers to PMA will be presented monthly with scenario and sensitivities which delve into the greater market dynamics seen in the power space. PMA will be valuable to those in the Oil & Gas, Coal, and Power industry. For the Oil, Gas, and Coal companies the focus will be on better understanding on fuel consumption in the power sector. The power industry the fuel and power prices will be available. In terms of functions within an organization, expect value to be given to Trading, Fundamentals, Budgeting, Fuel Contracts, and Policy groups.
There is more to come on PMA as we expect a product launch sometime in February.
Your Tireless Analyzing Energy Consultant,
614-356-0484
Twitter: AECDKB


