10 Year Weather Analysis Show 2010 Most Volatile Year
Weather has been one of the largest variable for power, coal, and gas markets. In the latest study available to PMA subscribers, each of the last 10 years of weather was put into our load and power model to deliver a concise view of the impact of weather.
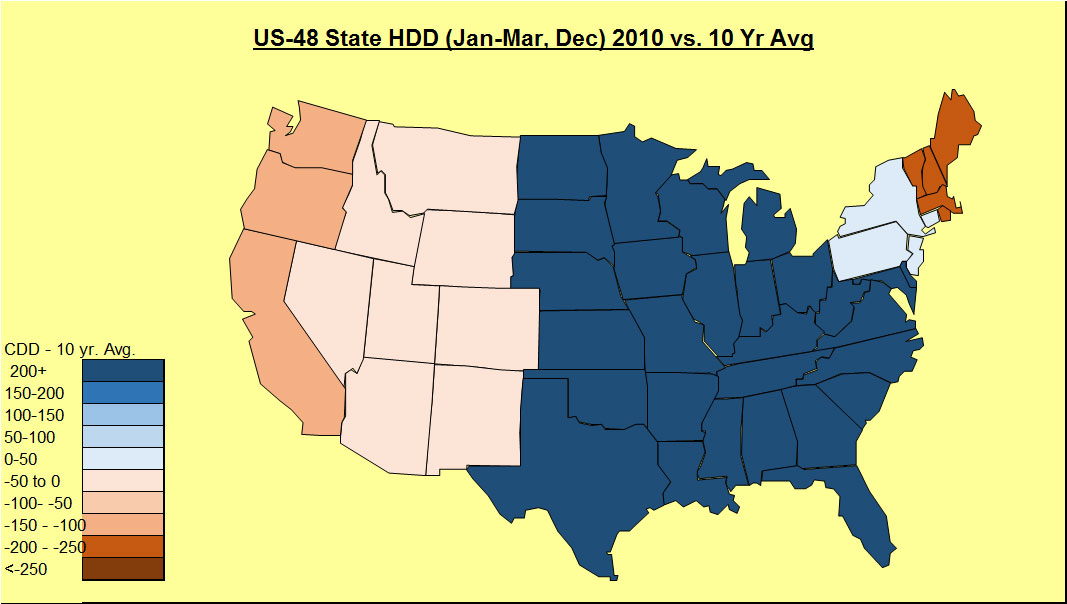
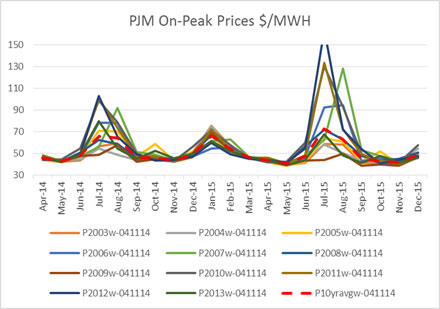
The study individually graphed the variation of weather for both summer and winter impact. The most volatile year happened to be 2010.
2010 Winter
2010 Summer
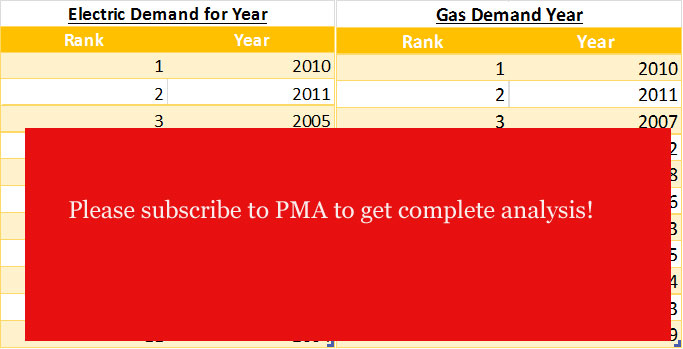
In addition, each year was ranked according to the electric and gas demand. The electric and gas demand do not necessarily align as different regions have various portfolio of generation options.
Total Year Ranking
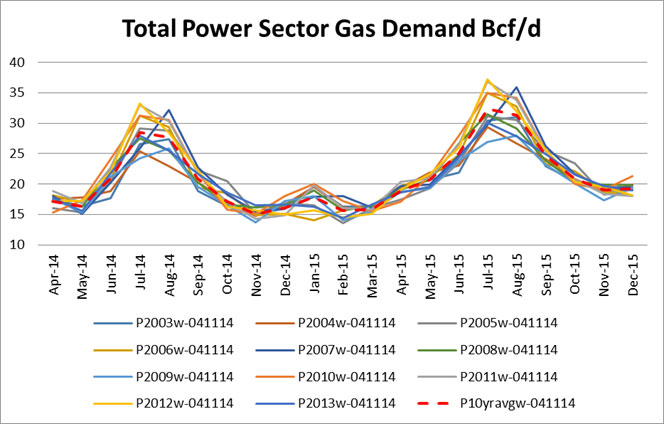
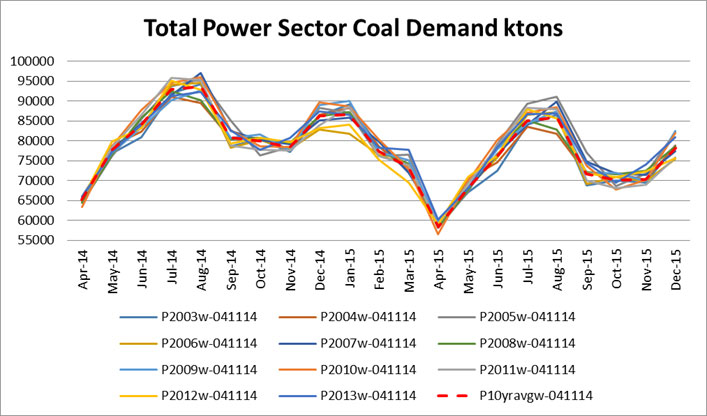
Fuel burns and power prices are also presented in the study.
Gas Demand
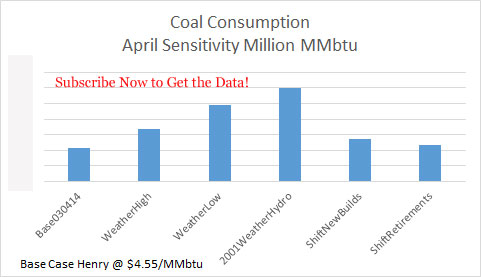
Coal Demand
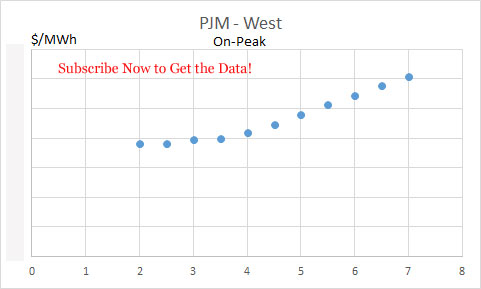
PJM On-Peak Prices
PMA subscribers get full access to the data files. Both on and off peak prices are in the data file plus over 15 regions across the country. Demand can also be broken up by state or even coal basin. This analysis allows weather to be quantified for gas demand, coal demand, and power prices. In addition any asset or portfolio can be extracted from the data to learn how sensitive these assets are to weather.
PMA subscribers get the online access, the daily files, and the study files. In addition, prime members receive-at no additional cost reports such as presented above, the Summer 2014 Outlook report , the recent briefing on what is causing the gas demand drop, and where it is coming from. Subscribers also have the opportunity for free private consultations. Discussions can range from answering more detailed questions on the studies to discussing potential scenarios of the future.
Our latest update to our daily file is designed for power traders and risk teams. The interface allows one to quickly see the current power forward curve along with the models view on the market. There is also an additional line which adjust the models results based on historical tendencies in the model.
A demo of the daily file is available with restricted viewing. Click here to download.
Please contact me to schedule an online demo meeting [email protected] or 614-356-0484
Your Inspired Energy Consultant,
David
Founder & Principal
All Energy Consulting LLC
“Independent analysis and opinions without a bias.”
614-356-0484
[email protected]
blog: http://allenergyconsulting.com/blog/category/market-insights/
Normal Weather vs. 10 year Average – Significant impact to Gas and Power Markets
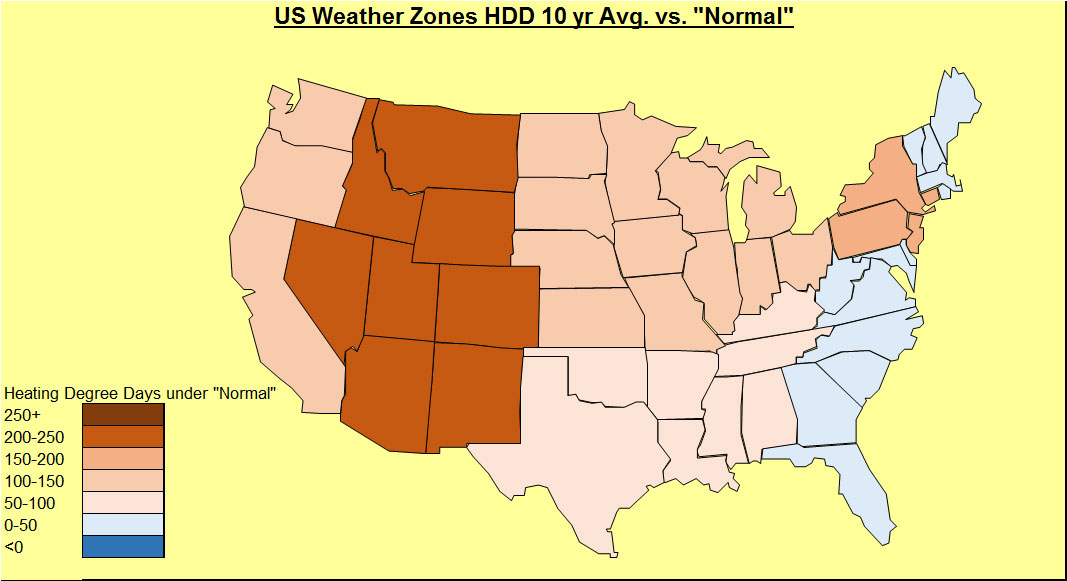
We are investigating “normal” weather. Our normal weather came from NOAA. According to NOAA, “Climate Normals are the latest three-decade averages of climatological variables including temperature and precipitation. This product is produced once every 10 years. The 1981–2010 U.S. Climate Normals dataset is the latest release of NCDC’s Climate Normals.” In the last 10 years, not many places have been close to normal. The trend in both HDD and CDD shows to be warmer over the last 10 years as compared to normal. More CDD and less HDD are observed when comparing to normals.
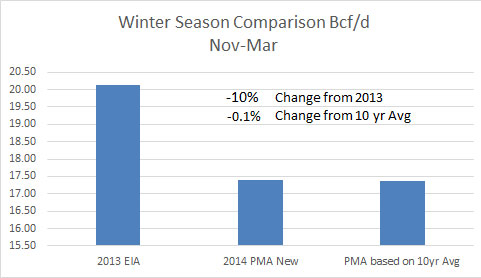
The 10 year average is clearly warmer than the NOAA normals. The impact on our base case in our Power Market Analysis (PMA) product shows a significant impact on the power markets. This translated to natural gas demand in the power sector rising 8% compared to the base case for this summer. Winter is essentially the same.
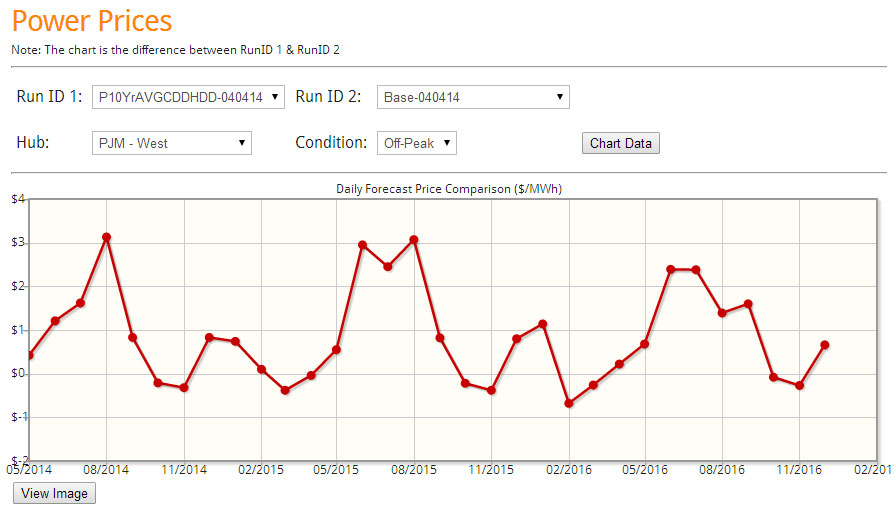
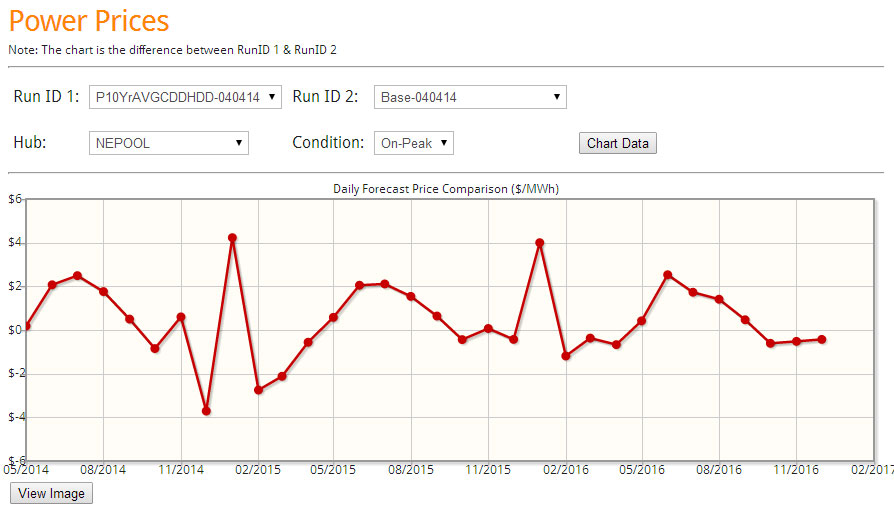
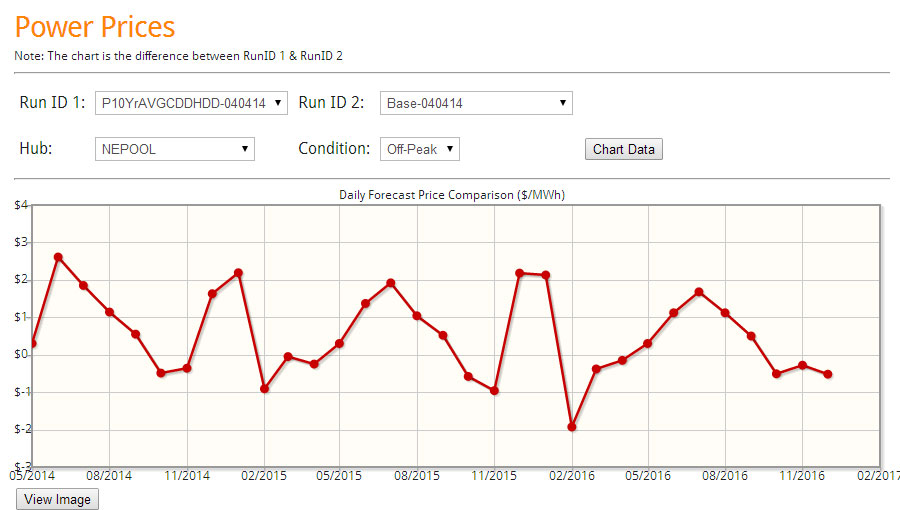
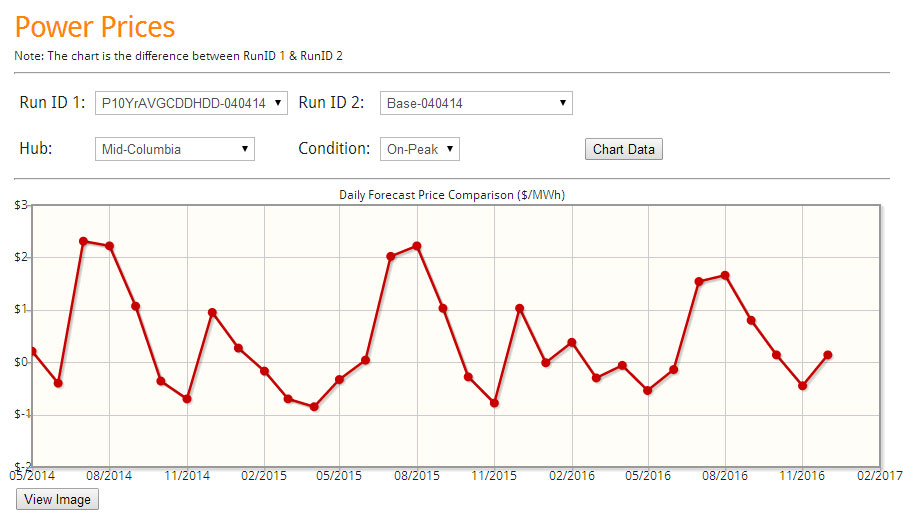
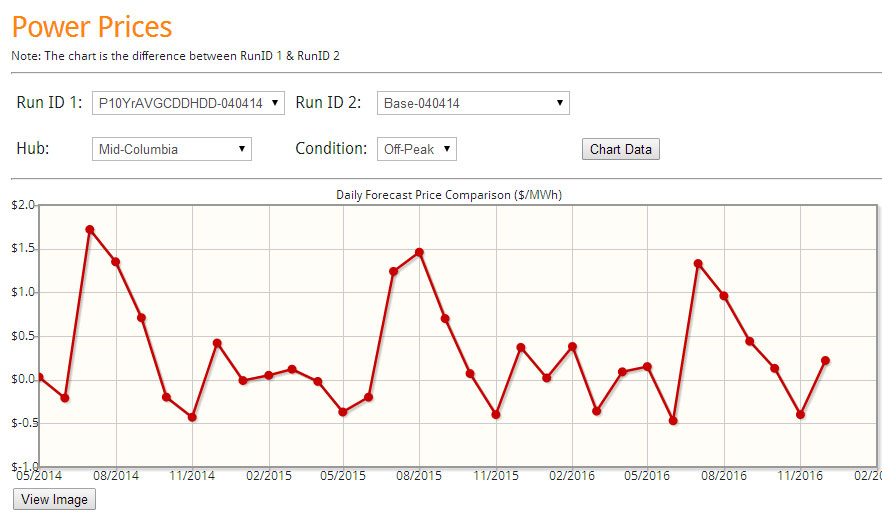
Power prices are significantly impacted by the weather change in certain regions. The below figures are screenshots which come from our online interface for our Power Market Analysis (PMA) subscribers. Each day the model dispatches the entire N. America based on the latest future markets price for coal and gas. Daily files are produced each morning similar to the above graphs. Plus the online interface allows users to quickly compare various runs. In this case, we are comparing the 10 year average weather vs. the Normal weather supplied by NOAA.
Many more regions are available to compare. In addition to power prices, there are comparison available for coal and gas consumption and input price comparison. Easy drop downs allow one to see how the future markets have impacted the power markets. PMA subscribers get access to the files including a complete analysis of 2015 and 2016 comparing the NOAA normals vs. 10 year average.
Soon, PMA subscribers will get a complete analysis of the last 10 year weather. Each year will be individually analyzed allowing subscribers to be able to choose analog years to represent the forecast.
PMA subscribers get the online access, the daily files, and the study files. In addition, prime members receive-at no additional cost-reports such as the Summer 2014 Outlook report , the recent briefing on what is causing the gas demand drop, and where it is coming from. Subscribers also have the opportunity for free private consultations. Discussions can range from answering more detailed questions on the studies to discussing potential scenarios of the future.
Please contact me to schedule an online demo meeting[email protected] or 614-356-0484
Your Inspired Energy Consultant,
David
David K. Bellman
Founder & Principal
All Energy Consulting LLC
“Independent analysis and opinions without a bias.”
614-356-0484
[email protected]
blog: http://allenergyconsulting.com/blog/category/market-insights/
Last two days gas futures down by 5% – What impact is that?
Everyday the model results of the latest market changes are awaiting for you. The majority of the time, the market doesn’t moved dramatically enough for you to care, but when it does Power Market Analysis (PMA)is there for you.
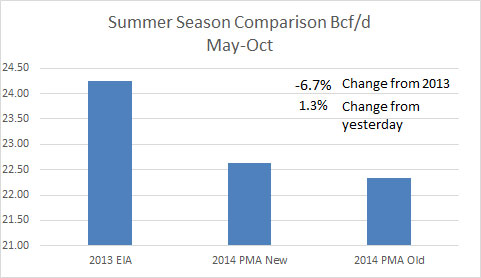
April 1st, 2014’s daily file shows the changing commodity prices resulted in an increase of 1.3% for natural gas demand for this summer relative to the March 31st file. The figure below comes from the daily file.
Our online interface allows you to compare daily runs on the fly. The below graph comes straight from the online interface and it shows the change in gas demand from April 1st, 2014 to March 28th, 2013 run. The above compared the April 1st, 2014 run to the March 31st, 2014 run. Summing up the below chart change for this summer, the last two days have changed the expected summer gas demand by more than 4%. (~0.9 Bcf/d.) Click graph to get enlarged version.
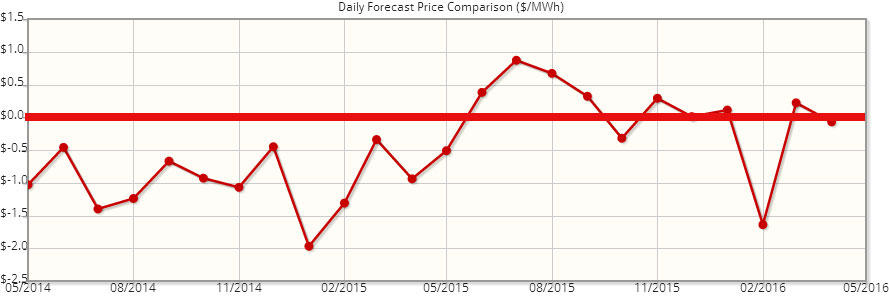
You can also compare future prices over time to get a sense of how the future’s market has changed over time. The below graph compares the Henry future curves of April 1st, 2014 versus February 28th, 2014. The red line is the zero line. Click graph to get enlarged version.
The market is valuing more future winter risk relative to the end of February. However, the rest of the time the market is lower than it was just a month ago. The prompt year is down by around $0.30/mmbtu.
The online interface offers a simple drop down to compare different gas basis. Dominion South Point continues to get more negative in April relative to February futures. Click graph to get enlarged version.
The online interface also allows comparisons of power prices across the country. The below show the impact of the last two days gas price drop on PJM-West On-Peak prices.
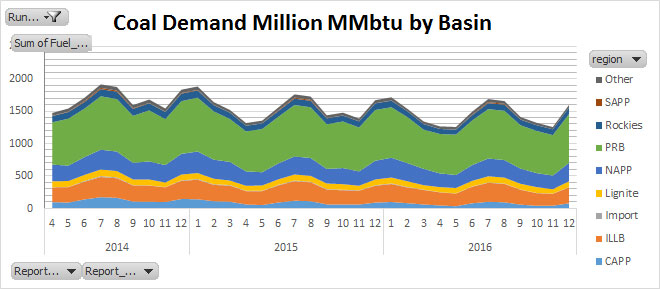
Coal burns by basin are now available. As coal units install control equipment, will we see a reduction in PRB? What type of coal will be hurt the most as coal units retire? These answers are available to PMA subscribers.
PMA subscribers get the online access, the daily files, and the study files. In addition, prime members receive-at no additional cost-reports such as the Summer 2014 Outlook report , the recent briefing on what is causing the gas demand drop, and where it is coming from. Subscribers also have the opportunity for free private consultations. Discussions can range from answering more detailed questions on the studies to discussing potential scenarios of the future.
Please contact me to schedule an online demo meeting [email protected] or 614-356-0484
Your Inspired Energy Consultant,
David
David K. Bellman
Founder & Principal
All Energy Consulting LLC
“Independent analysis and opinions without a bias.”
614-356-0484
[email protected]
blog: http://allenergyconsulting.com/blog/category/market-insights/
2014 vs. 2013 Gas Demand – Where and what is causing the drop?
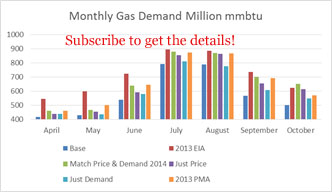
This briefing is a result of PMA subscriber request in better understanding the Summer 2014 Outlook report. After each analysis we spend time with our clients to explain the analysis and answer any questions they may have. One of our subscribers requested a set of 3 additional cases to further explain this year’s natural gas demand drop in the base case relative to last year. In one case, we used the 2013 price in 2014. In another case, we used the 2013 demand in 2014. For the final case, we ran both cases together to confirm the majority of the changes were coming from the both of them combined. The turn-around for these custom cases was less than a day. The results were formally presented on March 24th along with a call which included a question and answer period.
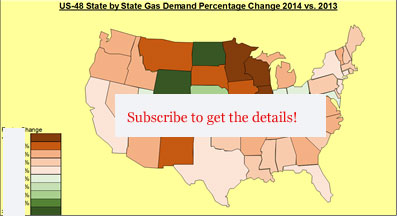
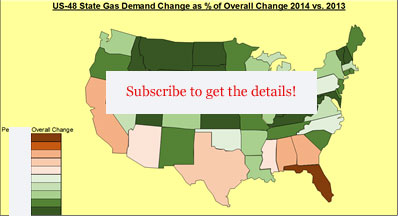
Another request was made by another subscriber to understand where the demand is dropping. A state by state analysis was done by comparing the 2013 benchmark run vs. the current 2014 base case. We compared the state changes. Several states had high percentage change as they were coming from small numbers to begin with. We then looked at it by the percentage of the total change for the US-48.
Download a free version of the briefing.
Please contact me to schedule an online demo meeting [email protected] or 614-356-0484
Your Inspired Energy Consultant,
David
David K. Bellman
Founder & Principal
All Energy Consulting LLC
“Independent analysis and opinions without a bias.”
614-356-0484
[email protected]
blog: http://allenergyconsulting.com/blog/category/market-insights/
Summer 2014 Outlook – Power, Gas, Coal, and Generation Fleets!
Over 90 graphs and 79 pages of hard-hitting analysis. This report does not regurgitate what you already know. Executive summary along with some graphs are presented below.
Though the report is 79 pages, it is still only a small fraction of what we could present. We are able to build off this analysis to produce any custom view or further analysis that is directly your concern. The power markets touch many, from traders, energy managers, fuel buyers, plant operators, government officials to fuel producers and many more. We have the ability to help you better understand the market by explaining what has happened and how the future can unfold and what you can do to prepare for that future.
The report is free to PMA Prime Members. Power Market Analysis (PMA) is a compelling product that provides subscribers a dynamic new approach to interpreting and explaining market fundamentals affecting North America’s power markets and their impact on the coal and gas industry. PMA Prime members can expect to get 4 quality in-depth reports a year along with other smaller insight reports each month. As an introductory price we are offering the report for $10K or $5K for one section.
A free version is available. Given our introduction into the market, the difference in the free version is limited. Free version is lower resolution and some parts are redacted.
Thoroughly analyzing the power markets can offer something for everyone given how much power touches everyone’s life. As demonstration of breadth, in the Summer 2014 report, we created a company fleet view. This would add valuable insights to investors in the utility industry.
Your Inspired Energy Consultant,
David
David K. Bellman
Founder & Principal
All Energy Consulting LLC
“Independent analysis and opinions without a bias.”
614-356-0484
[email protected]
blog: http://allenergyconsulting.com/blog/category/market-insights/
Executive Summary
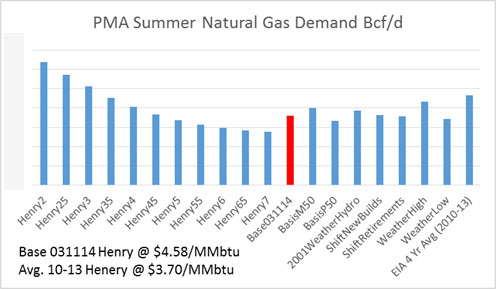
Summer of 2014 will differ from previous years as a result of one of the coldest winters in decades. The weather will continue to play a key role in how the summer unfolds. An in-depth and rigorous analysis is done on fuel consumption, power prices, and the top 10 utilities generation fleet. Power Market Analysis (PMA) processed 19 different potential sensitivities that could impact the power markets and presents key findings from those runs.
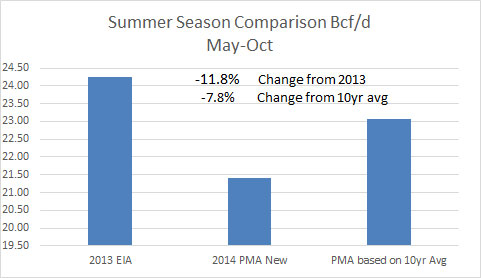
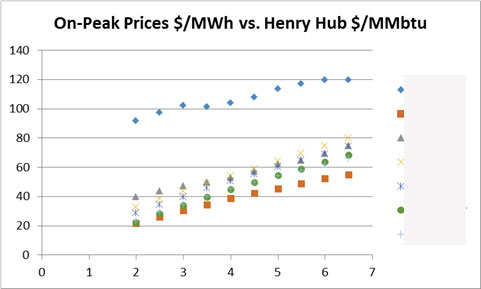
Gas demand is the most sensitive variable being easily impacted by elements such as changing commodity prices to weather. With the current forward curve of Henry Hub, prices this year will increase +23%, relative to 2013. This price change will significantly reduce gas demand in the power sector, assuming normal weather. Coincidently, the base case is showing a 23% drop in summer power gas demand compared to the four year average. The recent EIA Short Term Energy Outlook (STEO) is not anticipating much drop in power demand in 2014 relative to 2013. In order for that to happen, there are several changes in key variables needed, in some cases by themselves or in combination with other variables, to mitigate the gas demand drop in the power sector compared to 2013. An unusually warm span of weather can make up for the drop in gas, but this would have to be even warmer than the record setting summers of recent. The Western drought could impact the gas demand in the sector by almost 7% if the drought was similar to that in 2001. A price drop of almost $1/MMbtu could produce no drop in demand from the power sector. In addition, a further decline in negative basis could also add to gas demand. All this is displayed in the analysis below.
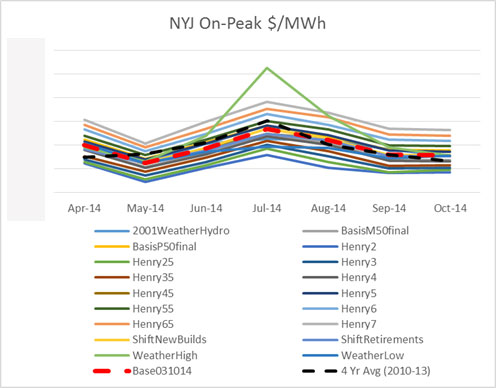
Power prices across the US will perform differently depending on the existing infrastructure and current generation fleet. There are areas which are very sensitive and can easily experience significant prices spikes – NY and ERCOT. Many areas are directly tied to natural gas prices. Other areas are showing little impact to power prices even if gas prices were to fall. There are usually trading arbitrages in power markets as the ability for the market to efficiently compute all possible changes is limited. Power market analysis requires a platitude of skill sets which then must be combined and deciphered to produce a cohesive picture. Many times, by the time the process is complete, the market has moved on. PMA subscribers get fresh daily runs, so whenever the market shifts, PMA is there with a snapshot of possible scenarios. The various power markets have their own characteristics. This can be seen in the analysis below.
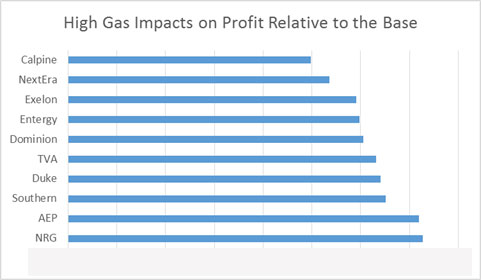
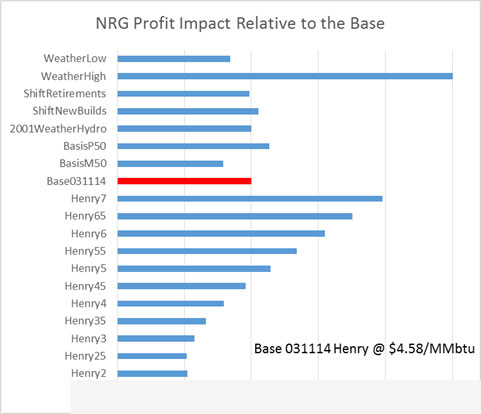
The top ten utilities fleet, by size of generation capacity, was reviewed under the various 19 cases. A proxy calculation was made on how the fleet could be impacted from the base case. Some fleets were much less risk averse to changes in the market. Whereas others could see a devastating profitability change if certain sensitivities come to fruition. All fleets would like to see a warmer than usual summer, but NRG and Calpine fleet can hit the lottery if this were to happen. There are many business strategies that can be designed once the knowledge is made on what makes the fleet “tick”. More company fleets are available upon request.
The Summer 2014 PMA analysis demonstrates the vastness of analytical capability and information available if power market analysis is well thought out and performed. PMA is designed for flexibility to offer multi-faceted views of the power market. There is so much more available in terms of reporting. If you would like additional information from these runs please contact us at [email protected] or at 614-356-0484. Also customized cases can be done for a fee.
Sample Figures:
April Natural Gas Demand Range
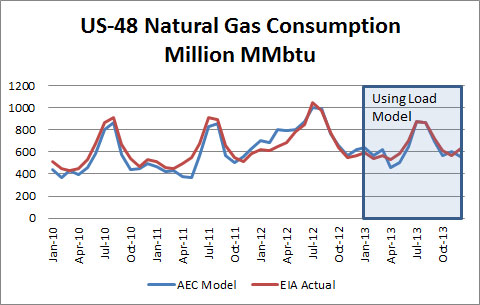
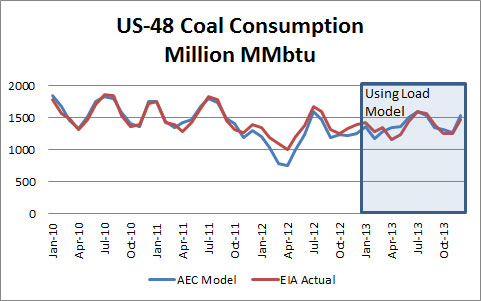
All Energy Consulting’s (AEC) latest product offering,Power Market Analysis (PMA) is a compelling product that provides subscribers a dynamic new approach to interpreting and explaining market fundamentals affecting North America’s power markets and their impact on the coal and gas industry. As requested, we have run our model in 2013 using AEC’s proprietaryload forecasting model. The results are outstanding! Once again substantiating the power modeling techniques used, plus adding more credibility to our load forecasting model.
Gas Burn in the US-48 Power Sector:
In 2013, the average gas burn was within 3%.
Coal Burn in the US-48 Power Sector:
In 2013, the average coal burn was within 1.5%.
Complete charts and data available now for subscribers.
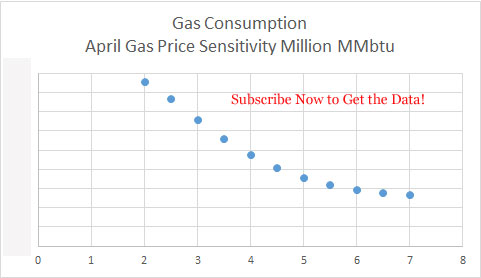
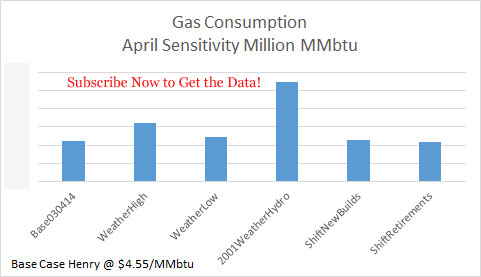
We also had time to take an early look into April gas consumption ranges running our monthly snapshot case. We reproduced our gas price iteration case and our sensitivity cases for the month of April.
Henry Hub Price Iteration Runs:
Complete chart and data available now for subscribers.
Natural Gas Demand at Various Sensitivities:
Complete chart and data available now for subscribers.
April hydro condition is still a key variable to keep an eye on just as we pointed out in our March analysis.
We improved our reporting spreadsheet by including the coal consumption plots. The improved output spreadsheet is available now for subscribers.
Henry Hub Price Iteration Impact to Coal:
Complete chart and data available now for subscribers.
Coal Demand at Various Sensitivities:
Complete chart and data available now for subscribers.
We also added a power price charting capability to our spreadsheet allowing our subscribers to see how the various changes impacted power prices from across the country.
Henry Hub Price Iteration Impact to PJM-West On-Peak:
Complete chart and data available now for subscribers.
PJM-West On-Peak Power Prices at Various Sensitivities:
Complete chart and data available now for subscribers.
The above analysis is all available to Prime Subscribers each month.
We are continually adding and improving PMA. One of our current projects is adding another insights category – Investors. We are compiling the various portfolio’s of the largest generating companies and will display their performance from PMA. In this section, we will answer the questions asked by investors, such as whose generating assets are at risk given various policies and commodity changes. Besides identifying the risk, we will calculate the extent of that risk. This will be another category that can be subscribed to individually. We will likely include it at no additional cost to those subscribing to the prime package.
Hopefully, it has been demonstrated that PMA can bring you great insights into the power markets at an incredible value. The above analysis can easily pay back your investment by helping you make better decisions whether trading, planning, purchasing assets, or being an investor in a utility. PMA will offer a better understanding of the power market from power prices to coal and gas consumption.
Your Inspired Energy Consultant,
David
David K. Bellman
Founder & Principal
All Energy Consulting LLC
“Independent analysis and opinions without a bias.”
614-356-0484
[email protected]
blog: http://allenergyconsulting.com/blog/category/market-insights/
P.S. Send an email to get a free one week trial.


