April Natural Gas Demand Range
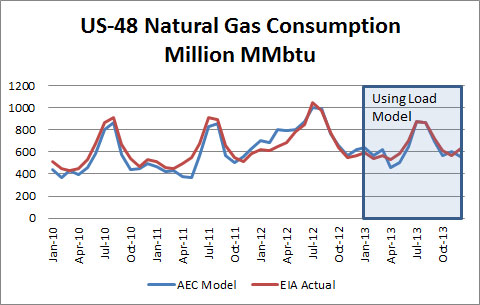
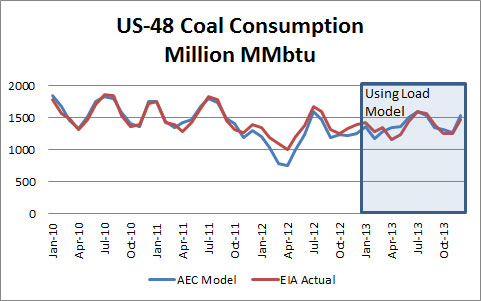
All Energy Consulting’s (AEC) latest product offering,Power Market Analysis (PMA) is a compelling product that provides subscribers a dynamic new approach to interpreting and explaining market fundamentals affecting North America’s power markets and their impact on the coal and gas industry. As requested, we have run our model in 2013 using AEC’s proprietaryload forecasting model. The results are outstanding! Once again substantiating the power modeling techniques used, plus adding more credibility to our load forecasting model.
Gas Burn in the US-48 Power Sector:
In 2013, the average gas burn was within 3%.
Coal Burn in the US-48 Power Sector:
In 2013, the average coal burn was within 1.5%.
Complete charts and data available now for subscribers.
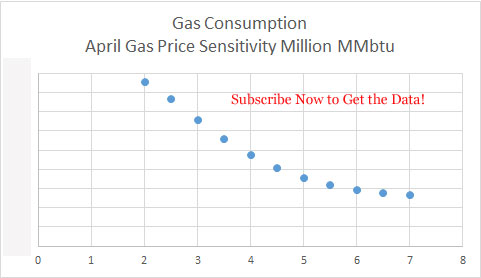
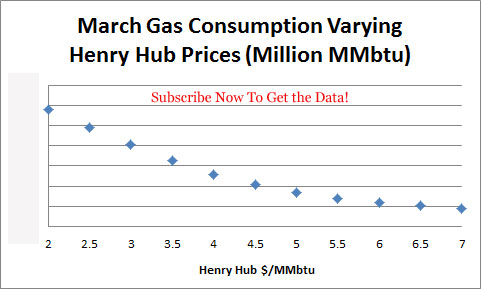
We also had time to take an early look into April gas consumption ranges running our monthly snapshot case. We reproduced our gas price iteration case and our sensitivity cases for the month of April.
Henry Hub Price Iteration Runs:
Complete chart and data available now for subscribers.
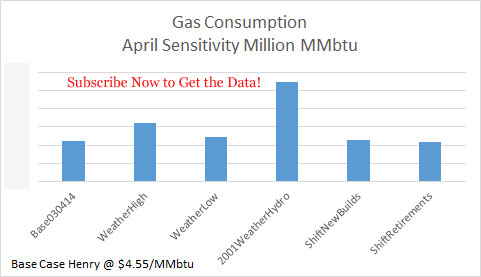
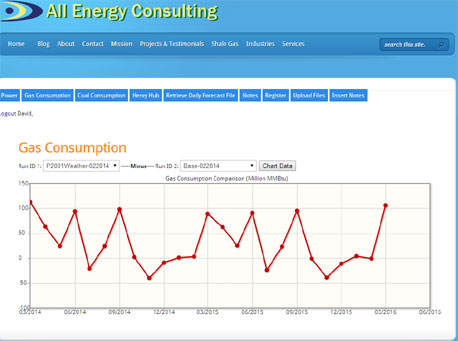
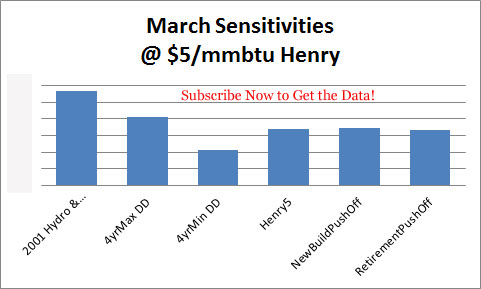
Natural Gas Demand at Various Sensitivities:
Complete chart and data available now for subscribers.
April hydro condition is still a key variable to keep an eye on just as we pointed out in our March analysis.
We improved our reporting spreadsheet by including the coal consumption plots. The improved output spreadsheet is available now for subscribers.
Henry Hub Price Iteration Impact to Coal:
Complete chart and data available now for subscribers.
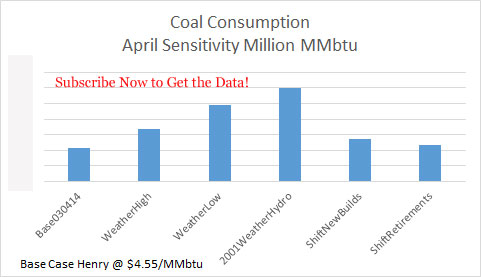
Coal Demand at Various Sensitivities:
Complete chart and data available now for subscribers.
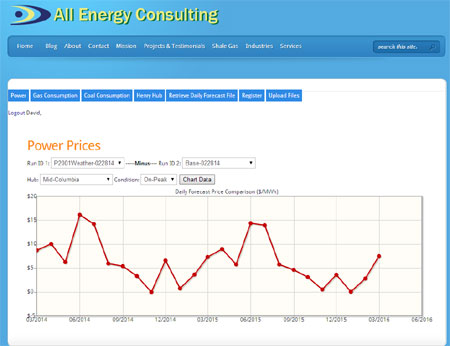
We also added a power price charting capability to our spreadsheet allowing our subscribers to see how the various changes impacted power prices from across the country.
Henry Hub Price Iteration Impact to PJM-West On-Peak:
Complete chart and data available now for subscribers.
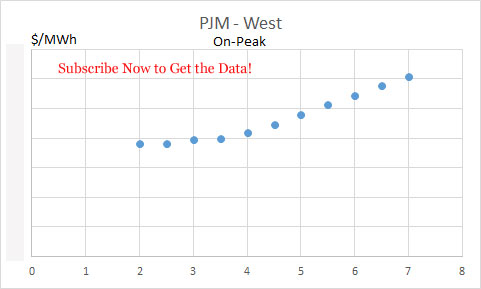
PJM-West On-Peak Power Prices at Various Sensitivities:
Complete chart and data available now for subscribers.
The above analysis is all available to Prime Subscribers each month.
We are continually adding and improving PMA. One of our current projects is adding another insights category – Investors. We are compiling the various portfolio’s of the largest generating companies and will display their performance from PMA. In this section, we will answer the questions asked by investors, such as whose generating assets are at risk given various policies and commodity changes. Besides identifying the risk, we will calculate the extent of that risk. This will be another category that can be subscribed to individually. We will likely include it at no additional cost to those subscribing to the prime package.
Hopefully, it has been demonstrated that PMA can bring you great insights into the power markets at an incredible value. The above analysis can easily pay back your investment by helping you make better decisions whether trading, planning, purchasing assets, or being an investor in a utility. PMA will offer a better understanding of the power market from power prices to coal and gas consumption.
Your Inspired Energy Consultant,
David
David K. Bellman
Founder & Principal
All Energy Consulting LLC
“Independent analysis and opinions without a bias.”
614-356-0484
[email protected]
blog: https://allenergyconsulting.com/blog/category/market-insights/
P.S. Send an email to get a free one week trial.
Ready for March Gas Demand? Duke’s Merchant Coal Plant Value?
All Energy Consulting’s (AEC) latest product offering,Power Market Analysis (PMA) is a compelling product that provides subscribers a dynamic new approach to interpreting and explaining market fundamentals affecting North America’s power markets and their impact on the coal and gas industry. Prime subscribers get additional analysis which is demonstrated below. Also demonstrated is the value PMA offers in generating custom reports from the daily runs at minimal cost for our subscribers.
In February, we started examining the hydro impact due to the drought in the West that is occurring now. Our initial findings show natural gas demand changes throughout the year with the most dramatic change in March.
Online Interface Screenshot – 2001 Weather and Hydro Condition Impact on Gas Demand:
Complete chart and data available now for subscribers.
Prices did materially change, but mainly in the West, as expected. As a subscriber you will get the full output and briefing of the run.
Online Interface Screenshot – 2001 Weather and Hydro Condition Impact on Mid-Columbia Power Prices:
2001 Weather/Hydro Run files available online see power prices and fuel consumption.
With March right here and now, we decided to investigate March gas demand. Our first analysis examined changing Henry hub prices by 50 cents from $2/mmbtu to $7/mmbtu. *This graph will be generated for the next month gas demand for our prime subscribers in the middle of each month.
Henry Hub Price Iteration Runs:
Complete chart and data available now for subscribers.
We then examined the various sensitivities at the $5/MMbtu range. From our analysis, it shows that if the hydro and weather aligns with 2001, we could experience a gas demand increase as significant as a dollar drop in Henry Hub prices.
Natural Gas Demand at Various Sensitivities:
Complete chart and data available now for subscribers.
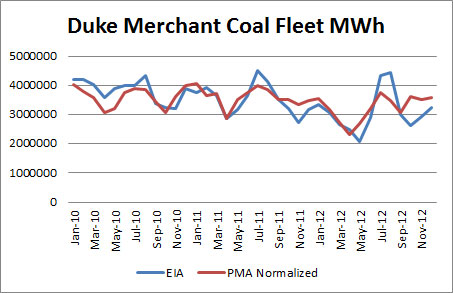
The above analysis is all available to Prime Subscribers each month. In terms of a custom report example, we put together an analysis of the Duke coal assets in the portfolio which is up on the market. Duke is selling this portfolio as whole looking for $2 billion. The coal assets represent the majority of the MWhs produced. In 2010, the coal assets represented 87% of the MWhs for those plants. An example of a custom report request might show how units performed in the model in the past and how they are expected to perform in future.
History of Coal Plants in Duke’s Portfolio MWh:
Based on our quick analysis, without any fine tuning, we can anticipate the Duke units will generate 6% less energy from their 2010-2012 actuals as Beckjord, and a Miami Fort unit is retiring. However, the economics compared to 2010-2012 will improve by 60+% as higher gas prices and regional supply/demand will benefit the units still running.
Future Expectation of Coal Plants in Duke’s Portfolio MWh:
As a subscriber to PMA, the above custom output request would cost you only $2K. In addition, you can expect a 24 hour turn around from request to final output. Output will include all the data behind the graphs.
We would recommend further due diligence if an acquisition was being pursued. AEC can help. Our due diligence efforts would involve reviewing historical performance to evaluate sustainability of the assets, fine tuning our model to accurately reflect cash flow for those assets, and performing long term scenario analysis to understand your risk. As a subscriber, you will get a discount to our consulting fee.
Hopefully, I have demonstrated that PMA can bring you great insights into the power markets at an incredible value. The above analysis can easily payback your investment by helping you make better decisions whether trading, planning, or purchasing assets. PMA will offer a better understanding of the power market from power prices to coal and gas consumption.
Your Inspired Energy Consultant,
David
David K. Bellman
Founder & Principal
All Energy Consulting LLC
“Independent analysis and opinions without a bias.”
614-356-0484
[email protected]
blog: https://allenergyconsulting.com/blog/category/market-insights/
P.S. Send an email to get a free one week trial.
Peak Demand in US Electric Sector
Continuing with our analysis from the previous post discussing Peak Energy, we delved into the Peak Demand. Peak Demand is measured in MW vs. Peak Energy MWa. Peak demand is typically define as the highest point of energy consumption. This is very important due to the nature of electricity. Compared to other commodities, the whole market would not crash for an extended period of time if one could not supply the peak demand point. However, in the case of electricity this becomes a real problem. Therefore, much planning is focused on peak demand and figuring alternatives to avoid peaks. Many commercial and industrial customers can see the bulk of their bill is tied to the peak vs. their average energy consumption.
As we discussed in the previous post, our objective is to produce a forecasting method for our new product, Power Market Analysis (PMA). Now that we had a very good system in forecasting monthly energy across N. America using GDP and CDD and HDD from various parts of the country, we needed a way to forecast the monthly peaks. The analysis of peak demand differed greatly from the analysis of peak energy. Applying the same statistical approach used in peak energy was going nowhere. First, we had to replace the monthly CDD and HDD with weekly maximums given we wanted to forecast peaks not averages. This improved the analysis. As expected, given the economic value of reducing peak vs. energy efficiency we saw many more regions decouple from economic growth in establishing peaks. We also modified the analysis to look at the relationship between average energy and peak demand. This method established a range for expected peaks in both a normal expectation of weather to extreme cases of weather variations within a month.
Counter to many who are have been alarmed at peak demand growing faster than energy, our analysis leads us to forecast a much slower growth in peak vs. energy. This is supported by the economic incentives to reduce peak demand is far greater than reducing energy consumption. In addition, measurement and validation of the various programs to mitigate peak demand is much more “accurate” than energy efficiency programs.
Power Market Analysis (PMA) will allow subscribers a very good view of the power markets and their relationship to the Coal and Gas markets. One of our goals is to increase the fundamental understanding of the market. We will issue monthly studies to our subscribers. The inputs will be clearly displayed for both the base and the extreme cases. Subscribers will also be able to customize runs. There is a large incentive for early bird subscribers. Please do reach out to me ASAP if you are interested in signing up to PMA (614-356-0484 [email protected] ). We will send a sample file you can expect from PMA. The official product launch likely in the later part of February. Besides a financial discount early birds will also be able to guide the product development of PMA and be able to get “free” reports while we finalize the product. We are building PMA to allow the evolution of the product. Our current long-term vision could have users having the ability to submit input changes and output be generated for them overnight.
Your Enthused Energy Consultant,
614-356-0484
Twitter: AECDKB
Refining Outlook Refined for 2014
As I review my last year’s thoughts on refining with updated data, it has caused me to be more bullish on the outlook for refining – which historically is very hard to do. US refining may be entering another golden age – or perhaps it never left, but just took a nap. There will be refiners who benefit more than others. However, the overall market should see additional boost.
What is new or more reaffirming from last year’s review:
- Continued liquids production from the shale plays.
- Crude imports are coming whether we like it or not by rail or by pipeline.
- Continued growth in developing countries.
Shale Play
Shale production continues to beat expectations. I researched over a dozen papers reviewing and analyzing shale decline curves and initial production rates. The amazing outcome is not the technology acceleration, but the ability to learn to use and adapt existing technology is accelerating. Each shale play is unique with an initial set of known. Applying the techniques done in one play to another play generally does not optimize the production. The ability to be creative with the tools and resources available has clearly shown an increase in production. Data is available showing initial production rates to decline curves are improving at wells within existing plays. In addition, the newer plays are seeing even a more accelerated path of improvements than the Bakken.
It is our belief, this will continue leading to more oil production in the US. And this oil production is of the sweet and light crude oil. This very fact is causing the US producers to want to lift the ban on exporting crude oil from the US. As discussed in my previous refining outlook discussion, the US refiners outsmarted themselves and built the wrong refining configuration. All is not lost; they just don’t value the sweet crude as much as the outside world might. At some discount, the oil will be processed and changes will be made in the US refining complex. This discount is driving producers mad and so the hope is with the ability to export. They could find better buyers across the ocean. In the meantime, without the lift in crude oil exports, we should continue to see a feedstock price discount to several refiners. This will cause a drop in finished product prices in the US for the consumer. However, I anticipate the drop in finished product prices to not be as low as the drop in feedstock prices given the export outlet for finished products.
Crude Imports
Crude imports are coming no matter what you are hearing about the Keystone pipeline issue. The Keystone pipeline encompasses a greater plan which is shown on this website. The project is actually three parts with 2 of three pushing forward as the main Keystone Pipeline still is being debated. Right now, we have 180,000 barrels/day of crude oil moving by rail from Canada to the US. The debate perhaps is really the rail industry supporting the ban on Keystone, because the oil will come, it’s really just how you want it to come here, assuming we still want to maintain free trade with our Canadian friends. This crude oil is more to the liking of the US refining sector. I suspect logic will prevail and the pipeline will move forward and pressure on the US crude oil markets relative to the foreign markets will maintain itself. The forward curve as of 02/06/14 continues to show a very stout spread between Brent – WTI of $14/bbl. Overtime, I suspect that to come back down to perhaps the $5/bbl range. However, I think gone is the convention that on annual basis they will trade in parity.
Non-OECD Oil Demand Growth
Over the last 8 years the OECD region demand dropped nearly 5 million b/d. The US represented nearly half of this drop with half of that drop coming from the push on alternatives fuels mainly ethanol. Ethanol production now stands at 0.9 million b/d. Biodiesel adds another 0.1 million b/d. Even though much is talked about renewable in the power space that there is now significant volumes to be discusses in the petroleum space. As I indicated in the power space reaching a peak consumption one can conclude the same in the oil space for US consumers.
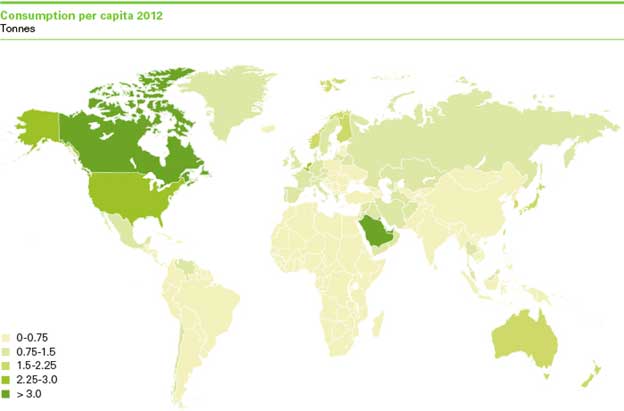
With the entire demand decline in OECD region, one would think prices should have declined versus rising 70% in the US gasoline markets. However, Non-OECD demand grew 9.7 million b/d over that same time period OECD was declining. There is so much more room to grow for non-OECD region. BP shows a graphical view of oil consumption per capita across the world. Even though the US observed a great drop in demand there is still a large gap between the US and the majority of the world.
With those three outlooks solidified, I am optimistic on US refining. Within the sector, there will be winners and losers. I can help the refining sector by offering crude oil evaluation to strategic planning to optimize the above concerns. A fundamental view of crude oil prices and refined products are available.
By the way I do have an opportunity for those interested in a 80,000 bpd condensate refinery in the Caribbean. A detailed cost study along with an economic analysis was done showing an investment need of around $600 million producing 20+% IRR. To build a brand new refinery of this scale would be around $1.2-$1.8 Billion. Please contact me if there is interest in this investment.
Your Continually Refining Energy Consultant,
Peak Energy – Are we there in the US?
Peak energy can be related to many things from Peak Demand, Peak Oil, etc… Let me clarify my discussion. Peak energy in my context is the electric energy being consumed by the end user each hour and averaged. Therefore, the unit of peak energy is Megawatt Average (MWa). This is much different than the peak demand Megawatt (MW) which occurs in one hour.
I am writing about this topic as I have just analyzed 118 Load Zones across the N. American continent. Statistical analysis was done on those areas incorporating 26 variables, which included 9 weather zones (CDD & HDD) and 8 economic regions starting with data back to 2009. This was an arduous and complex task as each individual zone needed its own menu of variables to optimize the analysis. AEC is about to launch a new online product – Power Market Analysis (PMA). PMA will be an online product with annual subscription access to power prices projections across the country and fuel consumption forecast of coal and gas in the power sector for the next two years – More information on PMA to come. Load represents a fundamental input in analyzing the power markets, so the task had to be done.
The results of the analysis are very eye opening. The R squared (indication of how well data points fits to the variables analyzed with – ranges from 0 to 1, poor to perfect fit) across all 118 load zones averaged 0.92. There were several regions which have now begun to decouple from GDP. The economic well-being of several regions is no longer driving the growth of power. At this point, I can hear grumblings and concerns at investor held utilities since the load growth is the main mechanism on shareholder returns. Don’t stop reading, it’s not all gloom or doom for all utilities. There are two main reasons for this decoupling of GDP. First is the increase spending in Demand Side Management programs across the country to a tune of $9 Billion. Second, we may have reached a peak point in energy consumption per capita. As you look around, how many more devices can you obtain? Each new device is incorporating better and improved efficiency. At some point, we will hit a limit to the energy consumption each of us can do. We are clearly seeing this in this analysis in certain large metropolitan areas when you strip out the weather component. However. I am only seeing this in certain regions.
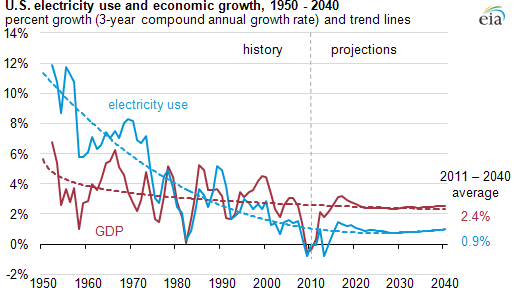
The EIA put out a briefing on March 22, 2013 alluding to this. The graph below does not seem to be weather normalized. This can lead to a skew vision of what has gone on recently.
Weather has been a large factor over the recent years. If you look at the GDP from 2010 to 2013 the growth is close to 4%/yr. If you look at electricity consumption without normalized weather the picture will show an annual decline of 1%/yr. However, if you strip out the weather component, the load growth is closer to 2.3%/yr. 2010 was an extremely warm year with cooling degree days across the country 21% greater than a normal year.
Weather variations will lead to consumption change as we have become quite temperate in our ability to adapt to various climates. The weather piece will need to be stripped out of the discussion when it concerns understanding the relationship between power consumption and the economy. Peak energy discussions cannot include a conclusion on the basis of extreme weather events. Based on our analysis we still project a rather robust growth in power consumption of 1.9%/yr for N. America based on normal weather and GDP growth around 3%. Areas that are seeing significant growth are related to the Oil & Gas areas such as Texas, Alberta, Louisiana, and even pockets in the Midwest with shale development.
PMA will offer a daily view of the next two years with three different scenarios – base, high power price, and low power price. The changes between the cases will be weather, GDP, and gas prices. In addition subscribers to PMA will be presented monthly with scenario and sensitivities which delve into the greater market dynamics seen in the power space. PMA will be valuable to those in the Oil & Gas, Coal, and Power industry. For the Oil, Gas, and Coal companies the focus will be on better understanding on fuel consumption in the power sector. The power industry the fuel and power prices will be available. In terms of functions within an organization, expect value to be given to Trading, Fundamentals, Budgeting, Fuel Contracts, and Policy groups.
There is more to come on PMA as we expect a product launch sometime in February.
Your Tireless Analyzing Energy Consultant,
614-356-0484
Twitter: AECDKB
LNG Export Revisited
LNG exporting discussion is increasing. Clearly the Oil & Gas industry is in favor of the initiative. On the other hand you have the Dow and Alcoa being concerned. Now the environmentalists have stepped in to denounce the plan. As I noted in my previous discussion on this subject last January I was more cautious on the level of exporting in the hopes that we could develop manufacturing and other creative ways of using a cheap and abundant resource. The question is to ask what is best for the country as a whole not to focus on certain questions as will it raise prices. A price rise is not bad in itself.
Since the last year, I have added my perspective by having intellectually challenging conversations with my many energy colleagues and friends. In general, I do agree with the premise that government should not be in the business of picking winners. My Oil & Gas industry friends will use this as instrument to justify their stance to export – not allowing exports you are picking a winning industry. As I noted before I think we should phase in the volume. In addition to staying true to avoid government picking winners – why are my Oil & Gas colleague not supporting my stance on auctioning of the export license in order to phase in the LNG export volume. Going site by site offers some element of picking winners. The US citizens should want to find additional funding for the government versus raising taxes and losing benefits. LNG export volume license would likely bring a decent revenue stream for the government and would avoid “picking” winners. Obviously the company that wins the license will still need to find an approved site along with approved technology which would pass environmental and safety needs.
I am always open to a discussion on merit. Please do send me email or feel free to comment below.
Your Open Thinking Energy Consultant,
614-356-0484
Twitter: AECDKB

