Finding Winning Power Trades – The Process

Many people have asked me to further explain the process of coming up with my recommend best winter trade posted on October 9th, 2014 which on 10/28/2014 was up over 20% in less than a month. Obviously the root of finding the trade was to use Power Market Analysis Near Term (PMA-NT). As I have noted many times PMA-NT is more of a service than a product. The default setup is still very useful without any customization, which I will demonstrate here. PMA-NT default is based on the forward curve. In this setup, the arbitrage being found are the disconnects between gas futures and power futures. In essence, gas futures get lost in translation converting to power futures due to the moving parts in the power sector. PMA-NT can help find those translation errors. PMA-NT can also be fed your fundamental outlook of natural gas markets to find those disconnects.
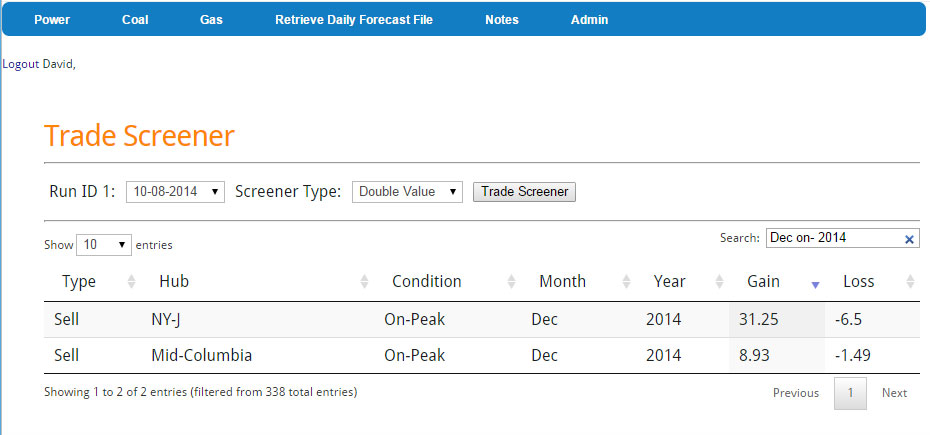
Part of PMA-NT includes some very advance and powerful trading tools. There are about 650 trading opportunities calculated in the default PMA-NT within in just 1 case (more can be added). The PMA-NT default runs five potential scenarios of the future. In order to find out my best winter trade I used a new customizable trade screener tool called Double Value versus One Sided Screener. Double value screens out all the trades with at least a double value relative to the potential loss. This list quickly reduces the 650 trading options. Given I wanted a winter trade and something that didn’t hold the risk of the Vermont Yankee nuclear retirement I filtered the results for Dec 2014 Winter. I also wanted a liquid contract so I filtered for On-Peak. Then finally I sorted by Max gain. All this occurred on one page in less than a few key strokes – screenshot below.
In the five cases simulated on 10-08-2014, the results show two trades that qualify on the logic that I wanted On-Peak trades in Dec 2014 that would have the potential to gain more than twice the loss potential. Out of the five outlooks simulated by PMA, there was a case that showed a potential gain of $31.25/MWh if one sold the NY-J On-Peak Dec 2014 contract. Inversely there was a case that would show a loss of $6.5/MWh. The default 5 cases involved moving the Henry Hub prices and altering weather impacts. These cases can be customized for your region of interest. Further descriptions of the default cases are available.
Now that I have identified a trade of interest I didn’t just stop there. As noted in the previous article I am risk adverse and would like a way to mitigate against tail-events such as pipeline explosions to other unforeseen extreme events. In order to mitigate the risk I usually use a spread or heat rate play. In addition, 5 cases are not enough for me to put on a trade – good enough to identify a trade. The good news is I also had run a Winter Outlook. The winter outlook included 54 more cases to examine. It was clear to me the NY-J power forward price was being impacted from last year’s polar vortex. This risk is a potential reality, but it would seem to be less of a probability. However because of my risk adverse nature, I wanted to find a price hub that was not taking into account the polar vortex as much as NY-J. Therefore if a polar vortex would occur to the level seen last winter I could be covered somewhat. Out of my 54 winter cases included running last year’s weather outlook, but without all the extreme outages. Base on that simulation it shows the AD-Hub having some room to run up with a polar vortex relative to the forward curve and relative to NY-J. The NY-J contracts seems to be limited as the “fear” premium is already in play.
Besides all these simulations I also did a walk back in history. There are many questions that needed to be understood. Polar Vortex last year was not really a January impact , how cold has it gotten in December and where did AD-Hub – NY-J spread moved to? As I noted in the previous article – From 2010 to 2013 December spread between AD-HUB minus NY-J went as wide as $-39/MWh in 2010. With the spread at $44/MWh I felt comfortable going with this trade as the best winter power trade.
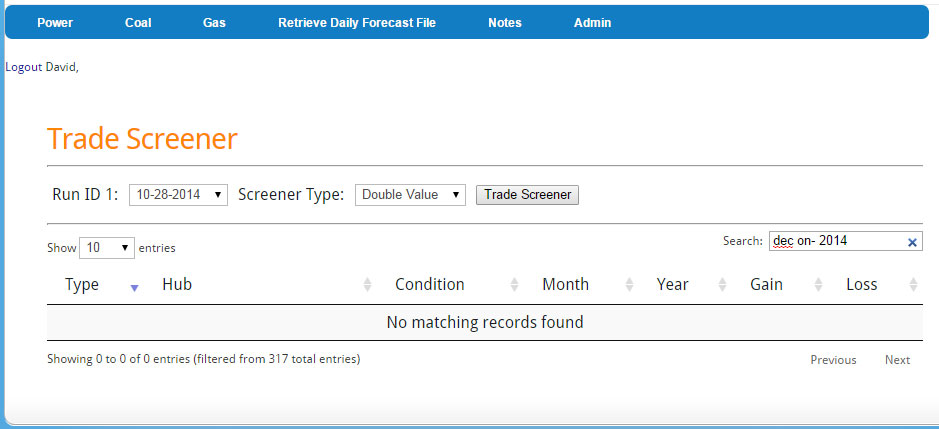
Given the market changes in less than a month, it is a good thing PMA-NT is designed to run daily. The exact screener on 10-28-2014 shows no trade opportunities in the Double Value category. The AD-HUB minus NY-J spread likely should be closed given the 20% return – per my risk averse nature. I am sure there are other traders who can stomach the swings better than me – looking for an aggressive trading partner to work together to create a perfect balance.
At All Energy Consulting we understand supplying you with forecasts is only one step of the process and may even be the smallest value of the process. The real value comes from the interaction with us and the willingness to explain the process and have frank discussions on the results. We believe no other consulting product will offer this unparalleled experience. You will work directly with me, an experienced analyst from one of the top energy consulting company (Purvin & Gertz / now IHS, Deloitte) and one of the largest utilities in the industry (American Electric Power (AEP)). PMA-NT is not just a product, but more of a service. We want to work with you in understanding the volatile power markets.
This also applies to our long-term service PMA-LT. We can work with you to understand the impacts of various policies and develop a cohesive resource plan.
Please contact us at your earliest convenience. We look forward to beginning the conversation.
Your Willing to Work with You Energy Consultant,
David
David K. Bellman
All Energy Consulting LLC- “Independent analysis and opinions without a bias.”
614-356-0484
[email protected]
@AECDKB
blog: http://allenergyconsulting.com/blog/category/market-insights/
Sign Up to AEC Free Energy Market Insights Newsletter


