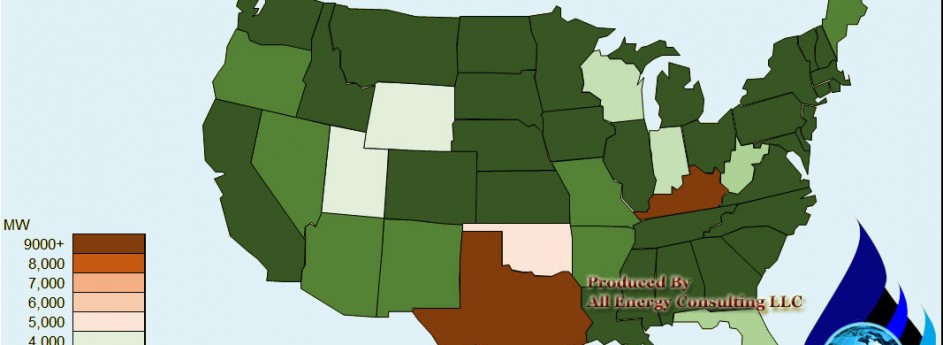
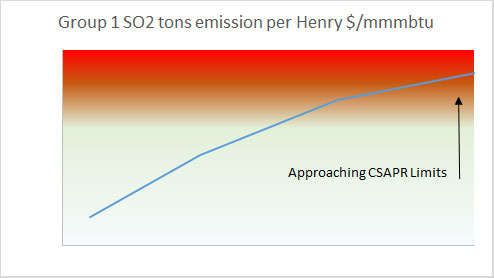
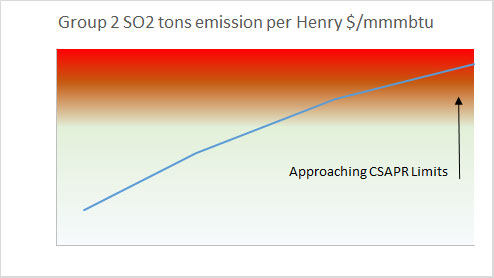
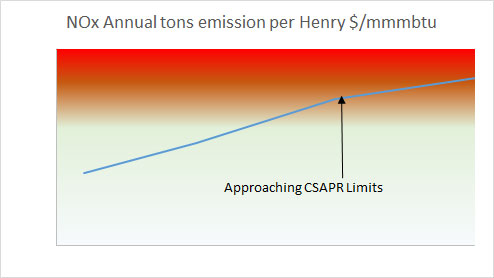
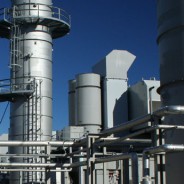
Are you ready for EPA CSAPR? NOx and SO2 Values Computed
Emission markets are one of All Energy Consulting core expertise given our work at the largest emitter American Electric Power. Modeling the emission markets requires game theory and operations research – both those categories are my personal favorite. With the Supreme Court reinstating Cross State Air Pollution Rule (CSAPR) in April 2014 and with the D.C. Circuit granted EPA’s request on October 23, 2014,, CSAPR Phase 1 implementation is now scheduled for 2015, with Phase 2 beginning in 2017.
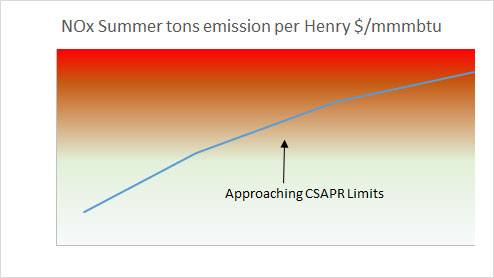
As typical of the emissions market, the initial market over reacted valuing credits way above reality – starting 2015 – 2015 NOx annual and season $250/ton and Group 1 SO2 $250/ton and Group 2 SO2 $450/ton. The market is slowly coming back to reality. One variable to watch is the direct link between the price spread between natural gas price and coal and the value of emissions credit. The smaller the spread the easier to achieve if not overachieve the goals set forth in CSAPR.
The key in modeling this system is to run multiple scenarios for the entire system and focus on the end total levels not a particular month. The ultimate value of a credit really is at the end of the season. This is akin to buying a stock option; the ultimate value of your options is when you can exercise that option. Making it slightly more complex is the banking. Therefore in order to truly value the program, modeling the end goal targets beyond year 1 will also be required.
We have run multiple scenarios and have computed values for NOx and SO2 along the paradigm of changing events from gas prices to weather. On a high level, the value of NOX and SO2 will be way lower than the current market pricing including accounting for the banking value. NOX summer is the most constrained versus the other emission credits. In order to make an effective decision in your emission credits please reach out to us to view our results of our analysis and potentially customize a case run for your portfolio. We can help you maximize your credit values.
Once again I promise unparalleled analysis and knowledge on this subject matter from me personally, not a person without any industry knowledge or experience in the emission markets. Please do consider All Energy Consulting for you emissions credits analysis – we are here for your success.
Your Emissions Market Expert Energy Analyst,
David
David K. Bellman
Founder/Principal
All Energy Consulting LLC- “Adding insights to the energy markets for your success.”
614-356-0484
[email protected]
@AECDKB
Modeling Efficacy Report
There are so many ways one can validate a model. In power modeling, the bottom line comes out to be how your model translates the various inputs (commodity prices, outages, load, hydro conditions, etc…) into power prices. We cannot know for certain the inputs we place into the model will be the outcome of the future. Developing a range of simulations allows that uncertainty to be quantified. The next and final step is to make actionable items from all the work. This actionable item ultimately proves the value and efficacy of the model.
In this report, we take our default Power Market Analysis Near-term (PMA-NT) and put it through the test of making sure it is able to translate the risk and produce profitable actionable trades from April to December 2014. Though you may not be into trading and rather want to understand your asset or your procurement risk, by proving this process it will surely prove to be useful for your needs. Every day the model produces results and a screener can be run. All this is stored so you can always go back and validate it. Unlike other consulting companies all calibrations and historical performances are saved and clients have FULL access to them.
The test we used was to produce a list of recommended trades using a screener at the end of the month for a monthly power contract three months out (e.g. April analysis for July Contract). The screener takes the forward curve of closing and compares it to the all the runs. The screener is customizable and shows the calculated gains and potential losses from the simulations. The screener that was used for this report was to find trades having an upside of 3X compared to its loss. Finally all positions were closed mid-month prior to expiration.
The results were beyond expectations – 43% return from April to December 2014 without any additional analysis. For each month the model was able to screen the entire N. American power hubs and find trading strategies that produce positive returns. There were no months producing negative returns. The screener was sufficient to reduce high risk trades yet produce some options each month. A full monthly analysis and listing of each trade strategy is available in this PDF.
There is still much room to make the model results even better. All the trades were weighted equally. Further analysis of history and using the 60+ simulations could have indicated better trades likely re-weighting or eliminating some trades. In addition, a spread analysis could have been done to reduce some of the risk. Employing current market intelligence in terms of liquidity and market directions could improve results.
We challenge your modelers / consultants to do this post analysis. Do not add any additional analysis but use just the model results and see if your model can really quantify risk to produce actionable items. Please accept our challenge and may the best model win.
Your Modeling Energy Analyst,
David
David K. Bellman
Founder/Principal
All Energy Consulting LLC- “Adding insights to the energy markets for your success.”
614-356-0484
[email protected]
@AECDKB
Modeling the USGC Refining Market
I had planned to continue to discuss the impact of oil prices beyond the obvious. In the first report on the impact of oil prices in the non-obvious areas, I discussed the likely impact to the Renewable Fuel Standards. I was hoping to follow up that report with the impact on condensate value as a result of the crude oil collapse. However, this has lead us into reviewing our refining models and also how the refining industry will likely have to evolve to handle the RFS.
As with many things in the energy market, you start with a hypothesis and investigate it only to be compelled to look at other areas in the market place. We are almost ready to release our first oil product, Oil Market Analysis (OMA), but first we had to make sure the refining models represented the USGC and was designed to incorporate the impacts of RFS. In this article, I have decided to go ahead and give you a tour of my problem solving methods when it comes to modeling USGC Refining Markets.
A key path for how I analyze the energy markets is to take a walk back in time.
Historical Changes in Refining
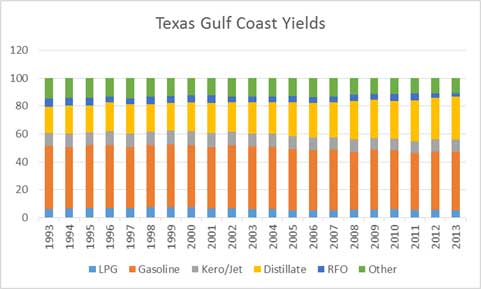
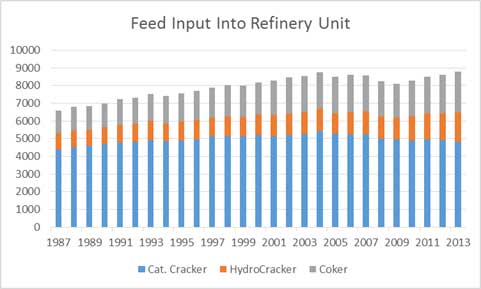
The yields of the USGC refiners have changed. Distillate yields rose while gasoline yields had the largest drop off.
This was not a result of refiners’ strategy from the 90’s nor was it because of the crude slate changes. The primary driver for this change came from the market price change starting in 2005.
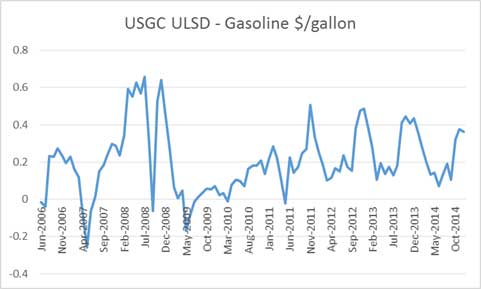
The EIA Annual Energy Outlook (AEO) was forecasting distillate spread to gasoline to be negative until the 2010 AEO release. The current AEO 2014 shows the spread averaging over $0.3/gallon. As with all free markets, they adapt to the pricing incentive. This change necessitates the adaption of the USGC refining configurations. This is also one of the reasons condensates are poor crudes relative to other crudes in the market as the distillate yield is very small.
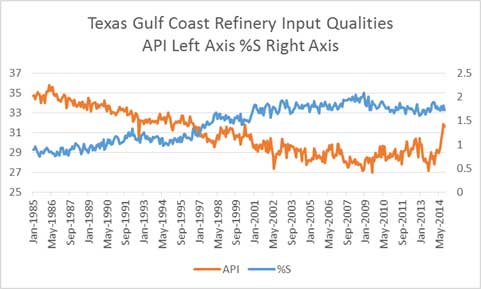
The quality changes did help the refineries produce more distillate, but many planned to expand and run their Catalytic Crackers and Hydocrackers. The price incentive has resulted in cutting back how hard those units run.
Calibrating USGC Refining Model
The first piece for calibration is putting a recipe of crude oil entering the USGC cracking and coking refineries. The average API for the last 12 months average around 30.2 API and 1.7 %S. The import data shows the major importers of oil for USGC are the Saudis, Venezuela, and Mexico. A crude slate from each of the countries were selected. Most of the import volumes were sent through the coking refinery. For those not knowledgeable in refinery – all coking refineries do have “cracking” capability via hydrocracker or cat. cracker. A blend of LLS, WTI, Mars, and Condensate represented the domestic blend. The volume on the domestic side went through both a cracking and coking refinery. The final recipe produced an average 30.5 API and 1.7% S.
Both refinery configurations were then adapted to produce similar yield seen in the market place. The refinery levers represented modification in cuts going into the various units along with conversion capabilities. We also looked at the market signals from octane values to maximize the refinery capability to produce high octane components.
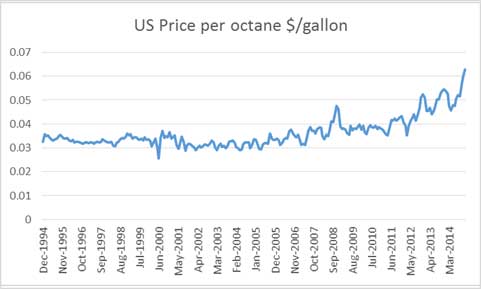
Octane pricing is a story in itself. The increase in value corresponds with the increase in condensate production. Condensates typically produce low octane products – another issue for condensates.
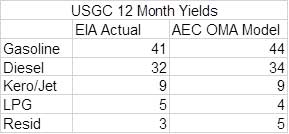
The final production of our represented cracking and coking unit in the USGC produced the following yields compared to the actual market production.
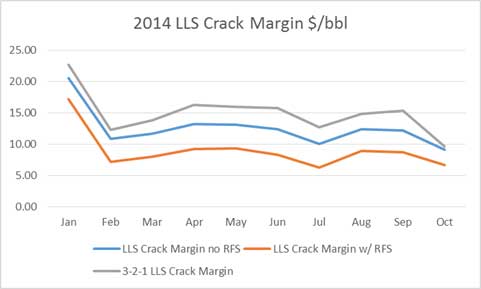
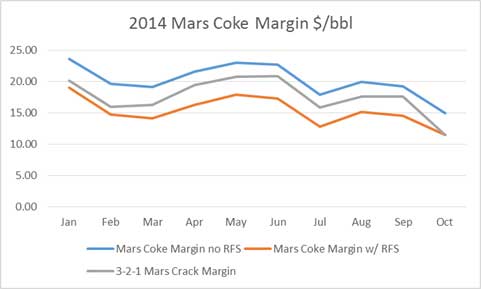
We then review the historical refining margins produced by the model depending on configuration and crude oil. The issue is whether we account for the ethanol requirement. As a crude produces more gasoline, the requirement for ethanol purchases are needed. Balancing some of the cost is ethanol octane is at 115 vs. 87 spec. For comparison, we use the simple 3-2-1 crack spread commonly used in the market place ( [2 x Gasoline Price + 1 x diesel]/3 – Crude Reference Price).
The yield and final market margins are the key step to how well your model is performing. Similar to our extensive work in calibrating our power models, we put the same effort into the refining models. We believe in transparency and show all our calibrations. As with any model, one can continue to improve upon it over time, but we will not be stuck in analysis paralysis. For vintage #1, we are pleased with the results.
Work in Progress
The results are promising. We will be filling our yield tables with various crude assays. The outcome of the work – Oil Market Analysis (OMA) – will produce monthly market expected refining margins based on the future markets. There is no need to wait for your consultants to put out a report days to months after the market has moved. OMA will be updated at the end of every business day keeping you on top of the market changes. The analysis will indicate the expected refining margins for gulf coast refiners. This will be helpful in guiding the valuation and expected earnings for USGC refiners.
An interactive website will be developed allowing users to select various crudes. This can be used to help guide crude oil optimization from pricing for contracts to informing buyers and sellers of arbitrage opportunities. The interface will also allow users to upload their own forecast of petroleum products or choose from All Energy Consulting custom forecast. With this capability, a user can customize and create endless amounts of insights. An end goal will also be to allow users to upload their own assays to be automatically run through our models. Currently, we can do this manually as this process requires some tricky programming to automate this feature.
Another thing we can offer is generating a model for East Coast, Midwest, and West Coast. The process and procedure will be similar to the above. Also, an international model could also be possible if we can find the information needed for calibration. Using this model, I plan to produce a report to calculate the value of condensates and further delve into the rapid growth in octane value.
Lots of fun analysis to do – who needs to sleep or eat?
“People who love what they do wear themselves down doing it, they even forget to wash or eat….When they’re really possessed by what they do, they’d rather stop eating and sleeping than give up practicing their arts.” Marcus Aurelius, Meditations
Your Tireless Energy Analyst,
David
David K. Bellman
Founder/Principal
All Energy Consulting LLC- “Adding insights to the energy markets for your success.”
614-356-0484
[email protected]
@AECDKB
Quantifying Power Price Risk
Given our completed summer 2015 analysis and our last power discussions centered in the East, we head West in this example analysis and quantify the risk in Mid-Columbia (Mid-C) power hub on a high level. In order to make an effective decision, one requires knowing more than the fact that higher gas prices, higher load, and lower hydro generation produces higher power prices – but by knowing the extent and the probabilities this leads to effective decision making. Power Market Analysis (PMA) is built to deliver you this knowledge by using AuroraXMP by EPIS and following the fundamentals of power modeling as described in the whitepaper.
Current Mid-C Market
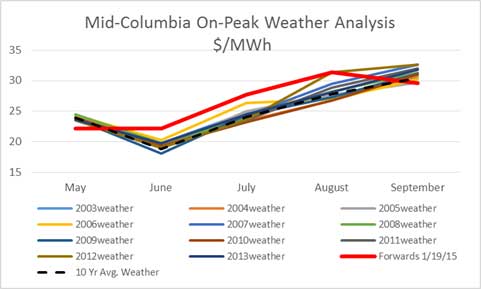
Examining the Mid-C On-Peak power curve, we see some very interesting results. The current forward curve for the summer rises from $22/MWh to $30/MWh by the end of summer. To many, these prices are likely extremely low. However, this is what you get in a hydro based environment with $3/mmbtu gas prices. Based on our preliminary analysis, it would indicate the prices can actually be much lower for many of the summer months. We ran over 60+ simulations for this summer.
Weather Analysis
To understand weather, we ran the last 11 year actual weather patterns and generated a new load forecast under those parameters. The weather changes in the region over the last 11 years are not that impactful in the summer. The largest standard deviation was in August at less than $2/MWh. This makes sense given the temperate summer weather in the Northwest.
Gas Price Analysis
To understand the impact on gas prices, we changed gas prices from $2.5/mmbtu to $6/mmbtu in 10 cent increments. The graph below displays the results in 50 cents increments. Holding all other variables constant, the changing gas price can have a standard deviation impact of around $8/MWh. The graph indicates the futures market is anticipating a higher heat rate than the model or the power trader’s sense higher gas prices by $0.5/mmbtu either through basis or Henry.
Hydro Analysis
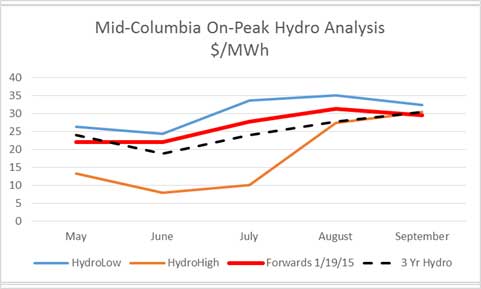
By far, the biggest risk to Mid-C is the hydro conditions. We examined 70 years of hydro conditions and used the 1929 case for the low hydro year and the 1997 case for the high hydro year. The forward curve is likely concerned about a low hydro year given the issues from the past few years. However, the prices can fall significantly if a hydro year similar to 1997 was to occur.
Potential Actionable Items
The use of such analysis is only valuable given your circumstances. The results of this analysis requires understanding you particular situation. At All Energy Consulting, we will collaborate with you to help you make the most effective decision.
End User
If I were an end-user with a good or service which is dependent on energy cost, I would consider locking in September pricing. If usage is low in May and June, it would indicate not locking in power prices those months. Depending on usage and risk tolerance, July and August could be too risky to lock in.
Power Generator
The low gas prices are causing much pain for the bottom line. However if you haven’t hedged that risk already, it may be too late. The declining gas price risk, given the strip currently $3/mmbtu, has a diminishing impact on power price. A 50 cents move up has more impact than a 50 cent move downward. I would monitor the rainfall and start selling some positions in May-July. I would request an Off-Peak analysis to further inform my decision.
Load Serving Entity
Off peak analysis is needed. An overlay of the usage curve along with the on-off peak prices will confirm the need to lock in prices for August and September.
All Energy Consulting can take this type of risk analysis and work with you to apply it to your situation and produced a comprehensive no-regret strategy and implementation plan. We have all the information for your region and can supply you with and even more complete risk analysis. We cover the entire N. American market and produce On-peak and Off-peak prices for all the major hubs. Our near-term simulations can produce a three year projection. We also offer a long-term solution covering the next 30 years.
We add value in your energy buying needs by offering in-depth analysis in order to empower you and make you confident in your energy decisions. Please do consider All Energy Consulting, we help all types of clients from power generators to end-users better understand the energy markets.
Your Looking Out for Your Success Energy Analyst,
David
David K. Bellman
Founder/Principal
All Energy Consulting LLC- “Adding insights to the energy markets for your success.”
614-356-0484
[email protected]
@AECDKB
Oil price drop impacts beyond the obvious – Part 1
I am analyzing many areas as a result of the oil price drop. There are a ton of discussions of oil price drop and the impact it will have on oil production and economy. However there are impacts at the secondary level which can have billions of dollars of impact on the market.
The oil market drop will impact the Renewable Fuel Standard (RFS). EPA suspiciously delayed the release of the Renewable Volume Obligations (RVO) for 2014 twice. With the latest oil price drop, I suspect they will have support for revising and recalculating gasoline demand expectations, which will then thwart any attempts to modify the RFS. Most of the support for revising the RFS requirements was due to falling US gasoline demand and the theoretical limit of the amount of ethanol allowed in the market – aka “blend wall”. This is based on gasoline with greater than 10% ethanol will impact the mechanical aspect of the existing auto fleet. I will not argue the point surrounding this and save that discussion for another time. Given this conclusion, I do anticipate you will see renewable identification number (RIN) prices move up once they do finalize the 2014 and 2015 volumes in the spring.
What are RIN?
For those not involved in the power markets, you will be slightly lost. For those who have gone through the trials and tribulations of the Clean Air Act (CAA) and the emissions markets the government created in order to create an “optimal” path to emissions reductions – it is very similar. Very similar to SO2 and NOx markets, the government assigns a target of volume and produces a certification for each unit of volume. The only difference this time is rather than wanting the volume to be reduced, they want the volumes to grow. Instead of assigning an emission credit, they assign a production credit. As a producer of gasoline or diesel, you are required to obtain a set amount of RIN for each volume produced. One can do this by physical blending and/or purchasing a RIN. Another difference is instead of assigning a multi-year level of commitment ahead of time as they did in the CAA, the EPA is supposed to assign it each year in the spring. The market does have a general idea given the RFS does state targets, but as a fuel producer you don’t know your specific requirements. The brilliance of this design, and at the same time the most confusing, is the banking system which is very similar to the CAA construct.
The RFS includes the magical banking system. They have learned from the initial CAA markets and have adopted the banking restriction similar to the NOx markets, but actually slightly easier to follow as they limited the banking system to 20% of the total RVO for each year. There is no decline in values on vintage basis. The vintages from each bank can be carried into future years. The banking system is the greatest invention since slice bread for those into Operations Research and Game Theory – my two favorite subjects. I have spent much time in the analysis of emissions banking and game theory, and I presented to AEP management the relationship between the CAA emission markets and the Nash Equilibriums which can be generated. Funny enough Dr. Nash grew up near one of AEP power plants, which I believed is pictured in the movie – Brilliant Mind. There are fixed outcomes for these types of systems. They are equilibrium points when all market participants achieve a certain goal.
I was the lead proponent in AEP to sell the emissions credit heading into the newly created NOx market in 2005. The NOx market once introduced and, upon an extreme winter, decided to go crazy. The prices of NOx went over $5500/ton. This far exceeded any of the equilibrium points. The other nuance you need to realize in markets which turn in a credit on a fixed date is the cost of a credit in a given time is somewhat irrelevant since the only real value of a credit is when you turn it in. If you want to make money on a system like this you had better spend time on the end market vs. what the market is now. Starting the NOX season with a huge rise in price was pointless, and one could run 50+ simulations and show even the hottest summer could not generate a demand level of NOX that would necessitate the price above the highest market equilibrium point. In the end, after a few years, the market achieved one of the lowest equilibrium points – variable cost of running the control equipment.
The other unique aspect of the RFS is the three levels of targets – Conventional, Biodiesel, and Advance. In theory, and so far in practice, this is the order of greater complexity and cost. The order also represents the highest volume targets to the lowest. The rules do allow one to use a credit from the more complex target into the simpler target not vice versa e.g. Biodiesel RIN can be used for Conventional RIN.
RIN Future
With the lower oil prices and the market structure with banking, I don’t see how one anticipates the modification of RFS with lower goals. The main argument of “blend wall” will succumb to greater oil demand as consumers not only drive more, but consume more. The US will not likely save more given the design of our system and culture. The very act of consuming more whether food or services increases petroleum demand. The banking ability of 20% gives much room to buffer the changing weather from crop issues to the changing economy from driving.
The low oil prices will impact the economics of many ethanol plants, particularly those that have not been built. On a sunk cost analysis, the economics should allow them to continue to produce ethanol. This situation only leads to even greater value for RIN. The trading and risk mitigation of RIN need serious consideration for those producing transportation petroleum for the US or for those making the RIN. At All Energy Consulting, we can take our knowledge in the emissions and petroleum market to help you weather the storms of the RIN market.
Other topics to come due to the drop in crude oil prices – Condensate Value …Octane Value…..
Your Energy Analyst Thinking Beyond the Obvious for Your Success,
David
David K. Bellman
Founder/Principal
All Energy Consulting LLC- “Adding insights to the energy markets for your success.”
614-356-0484
[email protected]
@AECDKB


