Finding Power Trades Arbitrages
Markets are only efficient in their ability to process and understand the markets. Power markets are likely one of the least efficient markets moving a month out largely due to its multi-variable dependency on multiple commodities and its lack of storage capabilities. Given this, there are many trading opportunities. PMA has incorporated trade screening capabilities to help identify arbitrages in the market. Three screeners were developed and can be customized – power price, power heat rates, and power spreads.
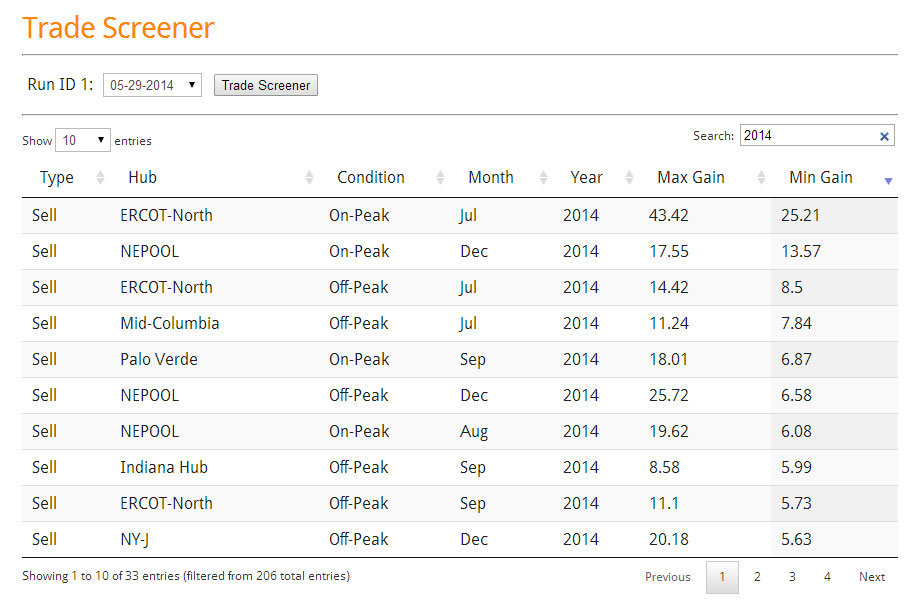
The power price screener searches through all the curves produced by the PMA process in all three cases – high, low, and base. The criteria for developing the high, low, and base can be customized. The screener compares each case to the forward curve. In the current default, the screener is finding trade opportunities where all three cases sit on one side of the forward curve. If it is above the forward curve it notes it as a BUY and calculates the maximum gain and minimum gain. If it is below it notes it as a SELL and calculates the maximum gain and minimum gain. Each morning you can come into PMA and process this. It takes less than a second to produce an interactive table where you can easily sort and search. As an example, we have a screenshot below:
Power Price Trade Screener
(Click Image to Enlarge)
In the above screenshot the model has screened through 1,620 potential cases. In less than a second, 214 trades identified and filtered to show only the 2014 trades. The trades are sorted on min. gain which essentially is identifying the best opportunities in the market with limiting risk. The model is favoring selling based on the filter criteria which is a reasonable expectation given the market premiums are rather large due to the strong winter experience.
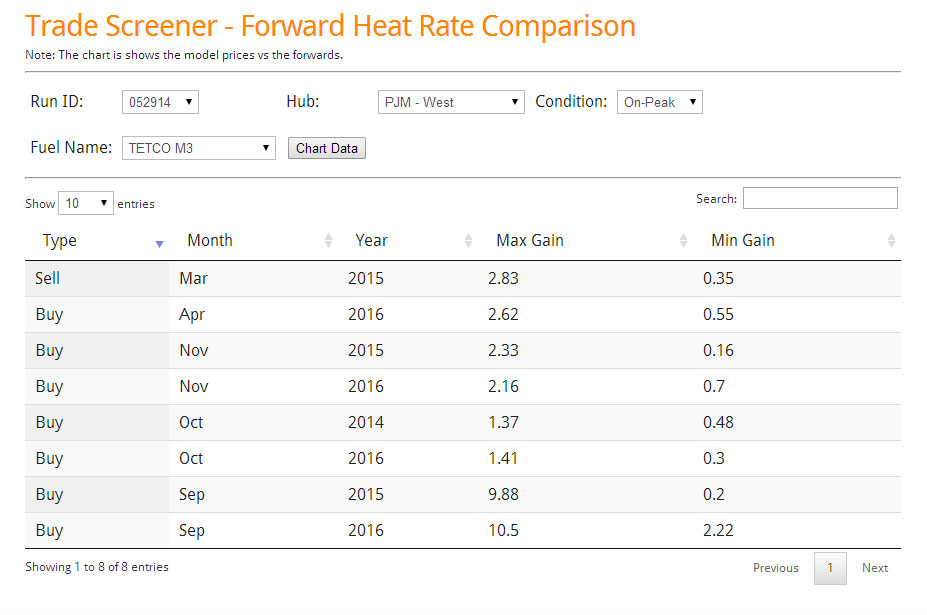
The next trade screener is the Heat Rate Screener. In this case, you have to pick the market and the gas basis you would like to use.
Heat Rate Trade Screener
(Click Image to Enlarge)
The above screenshot screened the PJM-West/ M3 heat rate curve. Only 8 trades passed our criteria.
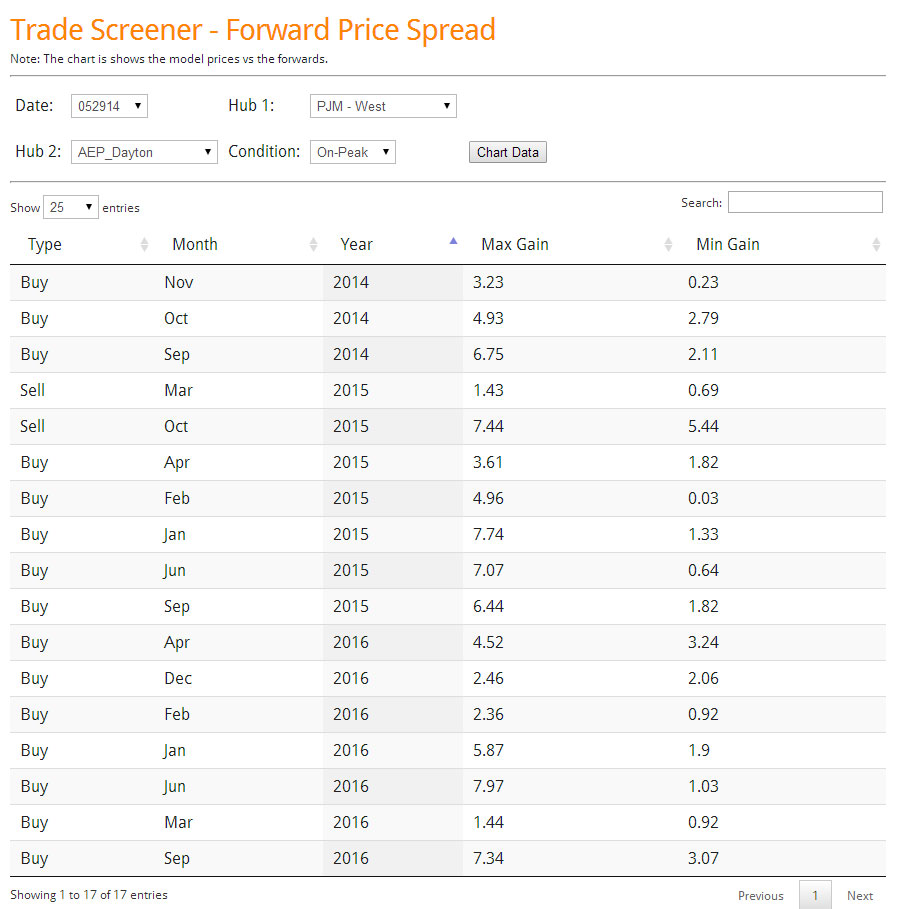
The final screener we developed is the spread screener. In this case, you pick the two markets you would like to examine.
In the above screenshot, we show the 17 trades for the PJM-West minus AD-Hub that passed the criteria. One of my personal favorite trade is showing up here – PJM-West-AD-Hub Jan Buy with a potential gain of $7.74/MWh and an expected min of $1.33/MWh. If the market gets colder you can probably anticipate higher prices in the west relative to AD. I suspect coal units this winter will perform much better than last winter per lesson learned. Likewise, if it gets warmer we can expect AD to fall much quicker with gas basis dropping more significantly in the region to compete with the coal units.
All these screeners and also the criteria for high, low, and base runs can be customized for you.
Please contact me to schedule an online demo meeting [email protected] or 614-356-0484
We are focused not only on supplying answers, but empowering you to find answers.
Your Inspired Energy Consultant,
David
Founder & Principal
All Energy Consulting LLC
“Independent analysis and opinions without a bias.”
614-356-0484
[email protected]
blog: https://allenergyconsulting.com/blog/category/market-insights/
Gas Storage Model – Predicting $1/mmbtu Weather Risk
A new tool is added to the PMA package – an interactive gas storage model. The gas storage model value lies in the set of 35+ pre-set runs for the power sector enabling the user to create their own version of the future without having to wait. AEC specialty lies in the power modeling world. With this in mind the model allows users to change their assumptions in the other areas of the gas balance (e.g. production, imports, demand outside power sector, etc.).
A demo version is available http://allenergyconsulting.com/Data/DemoGasStorage.php . The demo gives the user all the capabilities other than changing the prices for Henry hub in the months of Jun-October. An example of using the tool is described below.
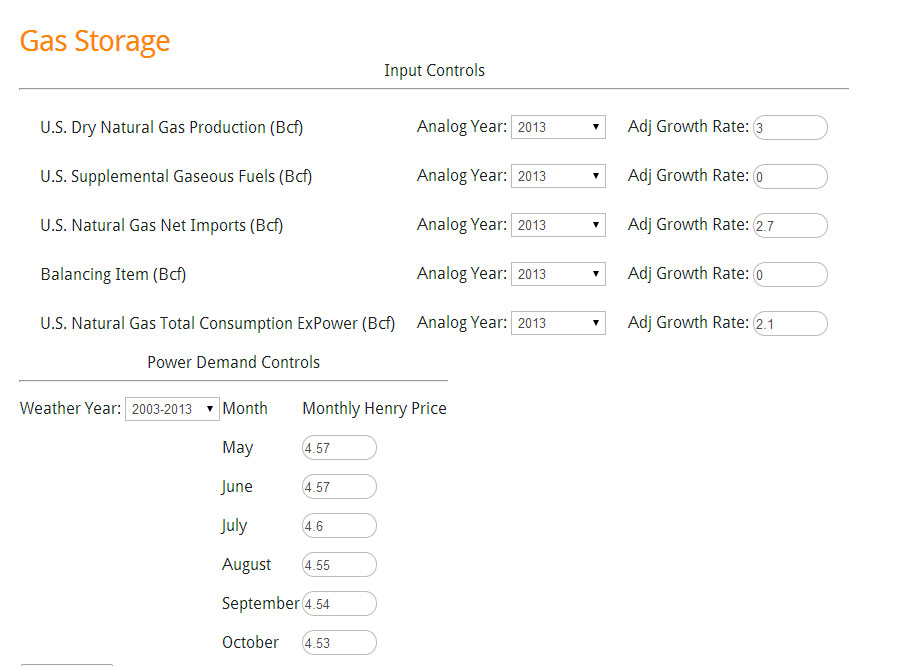
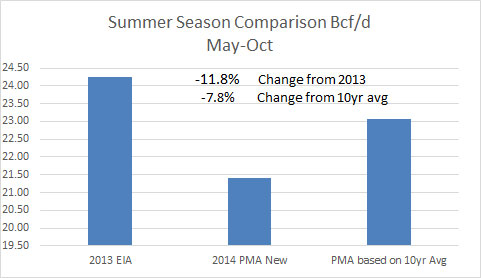
Recently the EIA did their own analysis of the end of summer inventory. In their analysis, they conclude ending storage level will be 3.4 TCF lower than the 5 year average of 3.8 TCF. To test our model, we used their assumptions outside the power sector. EIA assumed production only grew 3% from 2013. To put that into perspective, the 5 year average is closer to 3.8% and this was during very low price signals. EIA used imports that are much higher than the recent trend with an increase of 2.7%. 5 year average imports have declined by 15%. We also incorporated their price forecast – see below image.
Gas Storage Model Input (Click to Enlarge)
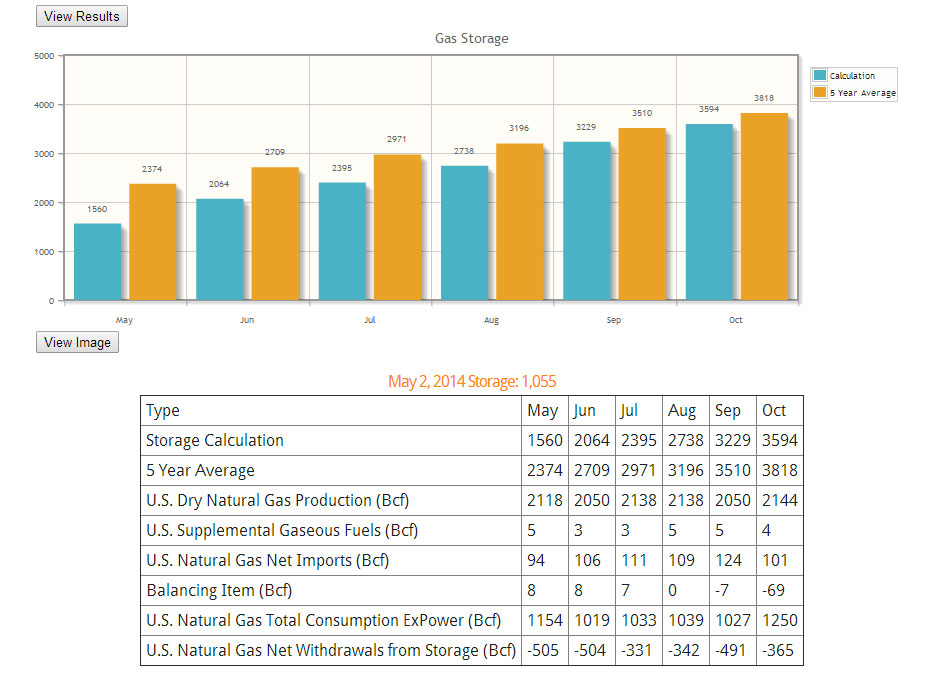
Using the 10 year average weather, our models show the final storage numbers closer to 3.6 TCF using all the assumptions. This was expected given the general under-estimation of the power sector to respond to significant rise in gas prices.
Gas Storage Model Output (Click to Enlarge)
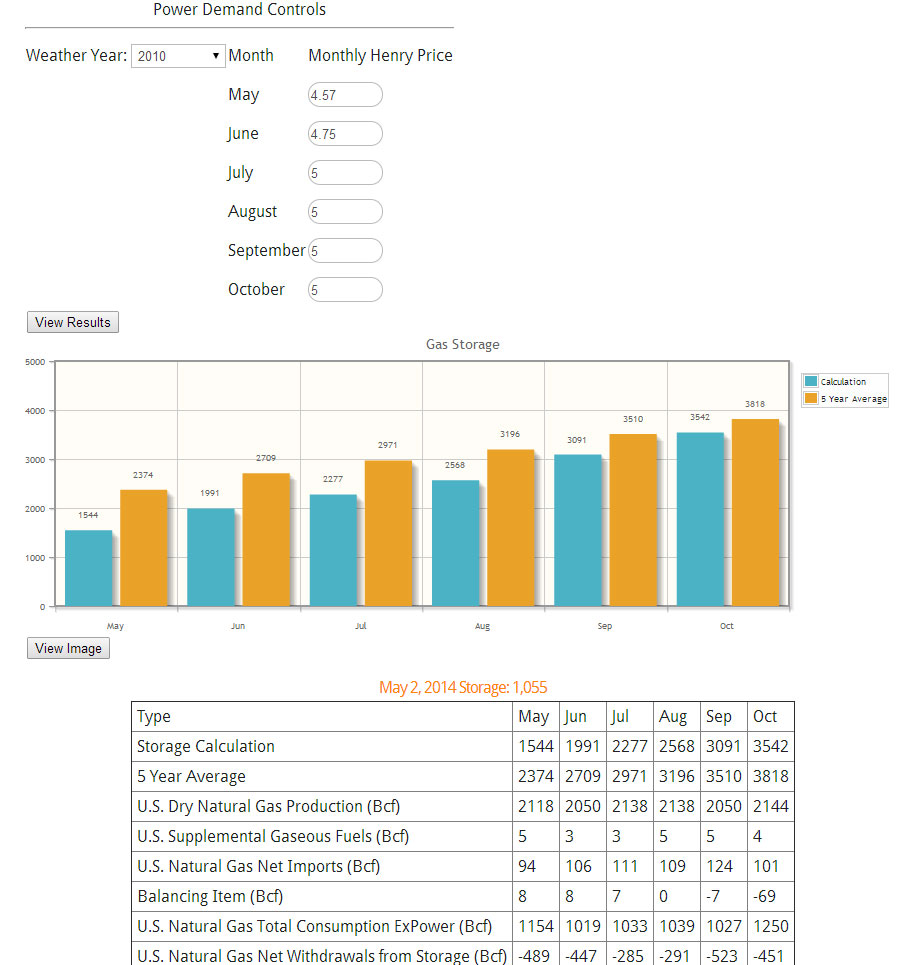
Another use for the model is to create your own gas price forecast by targeting a storage number. As an example, if we changed the weather to be an extremely hot summer, we can change the weather drop down to 2010 per our 10 year weather analysis report.
In this case, we had to change the gas prices in order to maintain a 3.5TCF ending inventory. The gas price that solved for this was $5/mmbtu. One can put even more finesse into the forecast by adding more seasonality than what was shown. In addition modifying the non-power demand would be a prudent task.
Gas Storage 2010 Weather Scenario (Click to Enlarge)
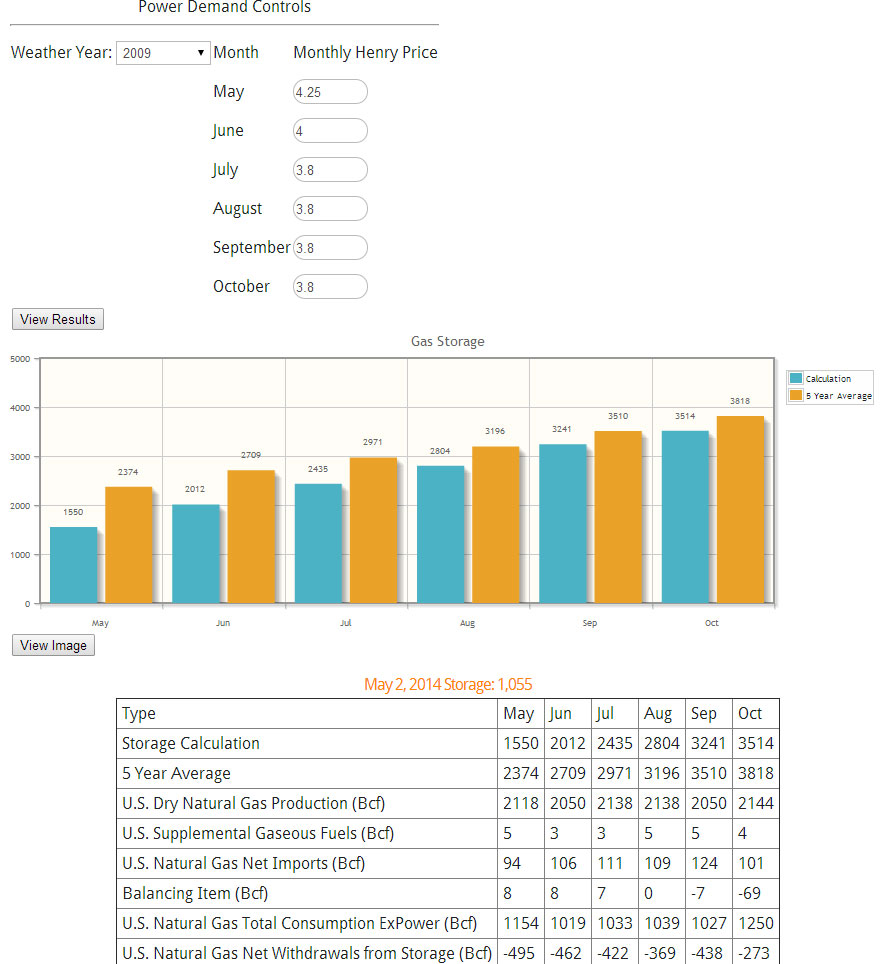
The opposite of 2010 would be 2009 weather. Applying the same technique and target of 3.5 TCF, we get a price level of $3.8/mmbtu.
Gas Storage 2009 Weather Scenario (Click to Enlarge)
Rather quickly, we now understand the weather risk involved in gas can amount to over $1/mmbtu.
The model does require updates since each week there is an update to the storage number. In addition, the relationships were established based on the April 22nd 2014 market prices. We plan to update the relationships monthly. The coming update for the model will include enhanced basis control plus be expanded to cover to the end of March of next year.
Besides the gas model, PMA subscribers get the daily files, and the study files. In addition, prime members receive-at no additional cost reports such as the the Summer 2014 Outlook report and the 10 year weather analysis. Subscribers also have the opportunity for free private consultations. Discussions can range from answering more detailed questions on the studies to discussing potential scenarios of the future.
Please contact me to schedule an online demo meeting [email protected] or 614-356-0484
We are focused not only on supplying answers, but empowering you to find answers.
Your Inspired Energy Consultant,
David
David K. Bellman
Founder & Principal
All Energy Consulting LLC
“Independent analysis and opinions without a bias.”
614-356-0484
[email protected]
blog: https://allenergyconsulting.com/blog/category/market-insights/
Sell Winter PJM-West? Trading & Risk Product
A common question is how can I use PMA in my organization? There are multiple ways PMA can help your organization including enhancing all focus on the gas, coal, and power markets. PMA can increase your fundamental understanding in the gas, coal, markets. PMA can help you evaluate generation assets and portfolios. PMA can also be used to evaluate risk and trading opportunities. In the following example, we will describe a simple case of how PMA can deliver a potential trading opportunity and be used to evaluate risk and reward.
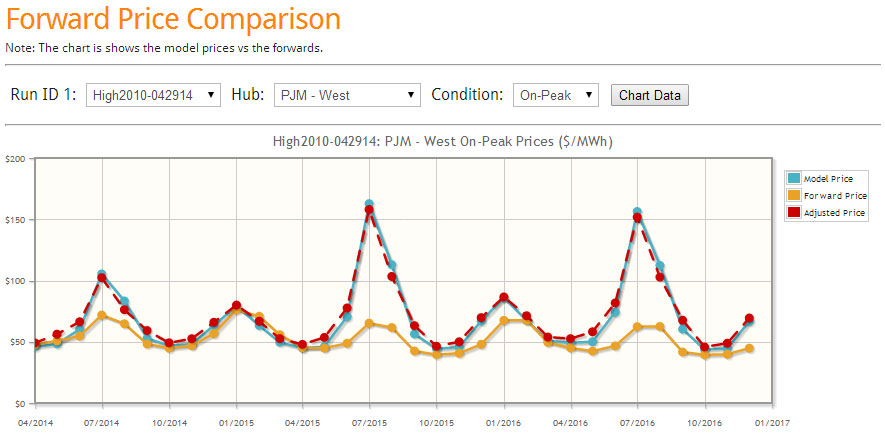
With the new online interface, one can quickly get an assessment of the model in relationship to the forward curve. PMA runs every day with the latest futures markets prices for natural gas and coal. Three scenarios are run each day – Base, High Power Price, and Low Power Price case. The Base uses a normalized weather based on 2003-2013. The high uses the 2010 weather pattern, and the low uses the 2009 weather pattern. The selection of these years are based on our 10 year weather analysis just completed a few weeks ago. The high and low also changes henry hub and retirement and builds plus forced outages – a complete description of the cases are available for our subscribers.
The following are direct screen shots from our latest online interface for the April 29th runs. Three lines are presented. The yellow solid line represents the forward curve. The blue solid line represents the model output. The dash red line represents the historical tendency of the model from our 4 year calibration run by month. In the example below, the model has a tendency to under-forecast the shoulder months- therefore the dash red line above the blue line.
Base Case (click image to enlarge)
In the Base Case, we can identify that this year summer and winter could be a potential sell given both red and blue line below the futures curve.
High Case (click image to enlarge)
In the High Case, the summer sell is not looking too good. If the summer temperatures are to be similar to 2010, and gas prices move up 50 cents and planned new builds fail to perform or deliver as expected, PJM West summer prices can blow up leaving the sell summer trade losing over $30/MWh in July. However, the winter trade shows a rather smaller worse case scenario of $5/MWh in January.
Low Case (click image to enlarge)
The Low Case represents the potential reward of the sell trade. In the summer, the potential gain in the sell trade is around $12/MWh for July. This is the same spread seen for the winter sell trade for January.
Clearly, the risk and reward view would point to the winter trade over the summer trade. I would suggest a few more next steps before exercising the winter trade. Potentially, I would identify a spread to be long to balance mitigating against any major catastrophic event such as major gas pipeline issue. This spread can come in the form of ON-OFF peak spread, location spread, to a heat rate trade. To identify the other side, one can easily research that by using the drop down menus and following the same analysis above. Another step I would take is to run additional price, weather, and outage scenarios. PMA subscribers have complete access to all this.
Besides the easy to use online interface, PMA subscribers get full access to the data files. PMA subscribers get the online access, the daily files, and the study files. In addition, prime members receive-at no additional cost reports such as presented above, the Summer 2014 Outlook report , the recent briefing on what is causing the gas demand drop, and where it is coming from. Subscribers also have the opportunity for free private consultations. Discussions can range from answering more detailed questions on the studies to discussing potential scenarios of the future.
A demo of the daily file is available with restricted viewing. Click here to download. Please contact me to schedule an online demo meeting[email protected] or 614-356-0484
We are focused not only on supplying answers, but empowering you to find answers.
Your Inspired Energy Consultant,
David
Founder & Principal
All Energy Consulting LLC
“Independent analysis and opinions without a bias.”
614-356-0484
[email protected]
blog: https://allenergyconsulting.com/blog/category/market-insights/
10 Year Weather Analysis Show 2010 Most Volatile Year
Weather has been one of the largest variable for power, coal, and gas markets. In the latest study available to PMA subscribers, each of the last 10 years of weather was put into our load and power model to deliver a concise view of the impact of weather.
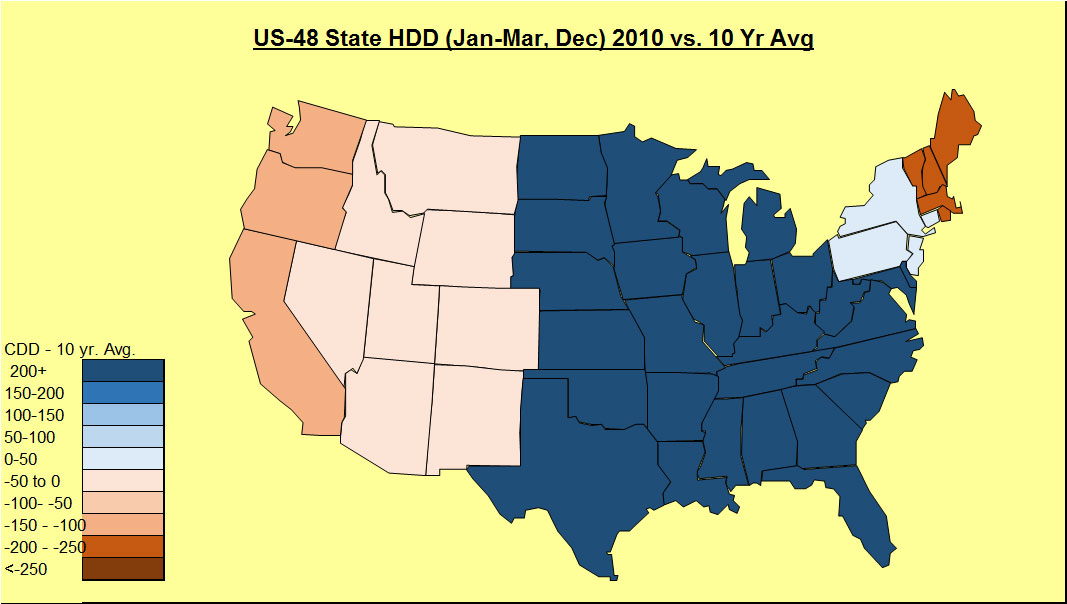
The study individually graphed the variation of weather for both summer and winter impact. The most volatile year happened to be 2010.
2010 Winter
2010 Summer
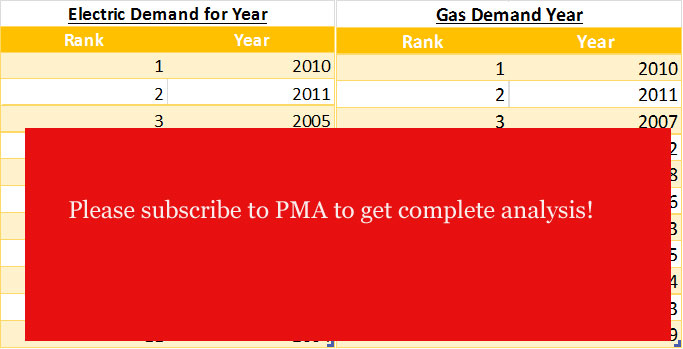
In addition, each year was ranked according to the electric and gas demand. The electric and gas demand do not necessarily align as different regions have various portfolio of generation options.
Total Year Ranking
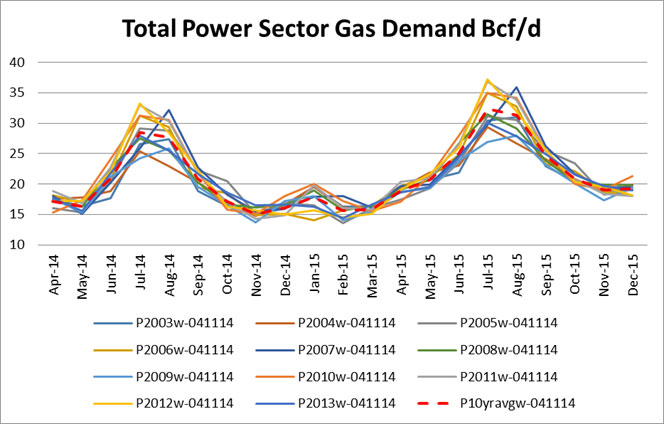
Fuel burns and power prices are also presented in the study.
Gas Demand
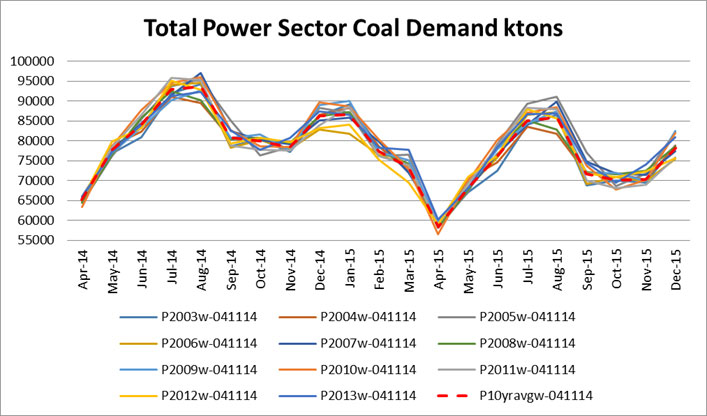
Coal Demand
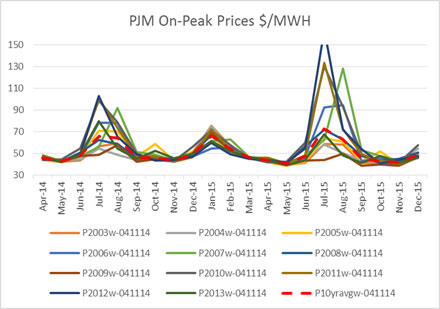
PJM On-Peak Prices
PMA subscribers get full access to the data files. Both on and off peak prices are in the data file plus over 15 regions across the country. Demand can also be broken up by state or even coal basin. This analysis allows weather to be quantified for gas demand, coal demand, and power prices. In addition any asset or portfolio can be extracted from the data to learn how sensitive these assets are to weather.
PMA subscribers get the online access, the daily files, and the study files. In addition, prime members receive-at no additional cost reports such as presented above, the Summer 2014 Outlook report , the recent briefing on what is causing the gas demand drop, and where it is coming from. Subscribers also have the opportunity for free private consultations. Discussions can range from answering more detailed questions on the studies to discussing potential scenarios of the future.
Our latest update to our daily file is designed for power traders and risk teams. The interface allows one to quickly see the current power forward curve along with the models view on the market. There is also an additional line which adjust the models results based on historical tendencies in the model.
A demo of the daily file is available with restricted viewing. Click here to download.
Please contact me to schedule an online demo meeting [email protected] or 614-356-0484
Your Inspired Energy Consultant,
David
Founder & Principal
All Energy Consulting LLC
“Independent analysis and opinions without a bias.”
614-356-0484
[email protected]
blog: https://allenergyconsulting.com/blog/category/market-insights/
Normal Weather vs. 10 year Average – Significant impact to Gas and Power Markets
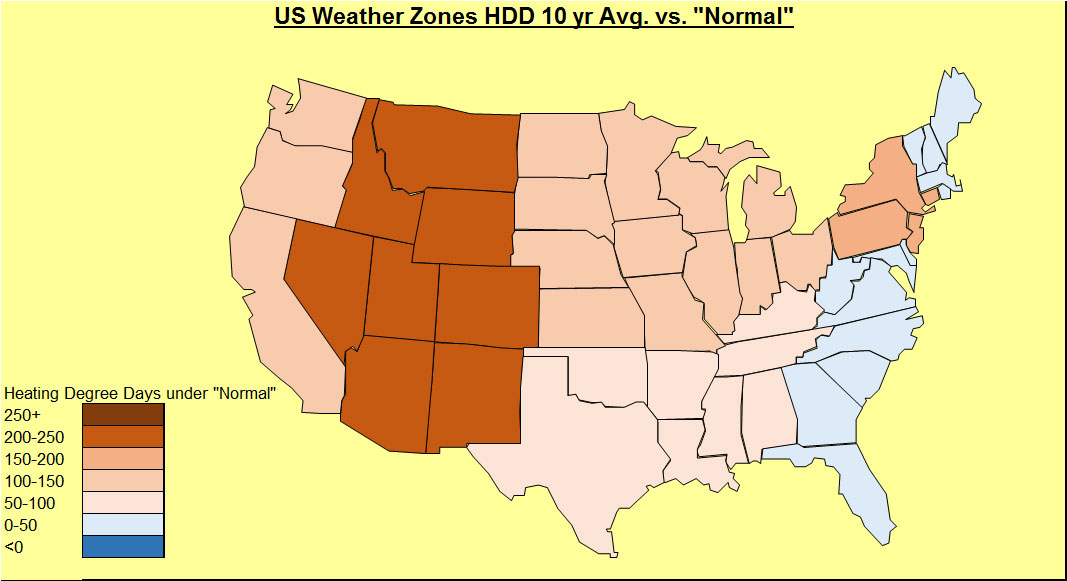
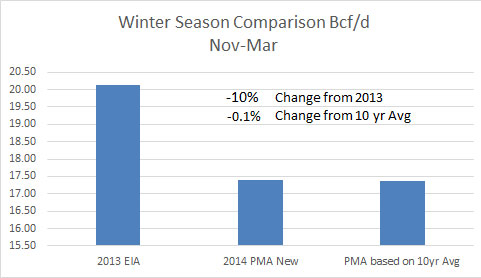
We are investigating “normal” weather. Our normal weather came from NOAA. According to NOAA, “Climate Normals are the latest three-decade averages of climatological variables including temperature and precipitation. This product is produced once every 10 years. The 1981–2010 U.S. Climate Normals dataset is the latest release of NCDC’s Climate Normals.” In the last 10 years, not many places have been close to normal. The trend in both HDD and CDD shows to be warmer over the last 10 years as compared to normal. More CDD and less HDD are observed when comparing to normals.
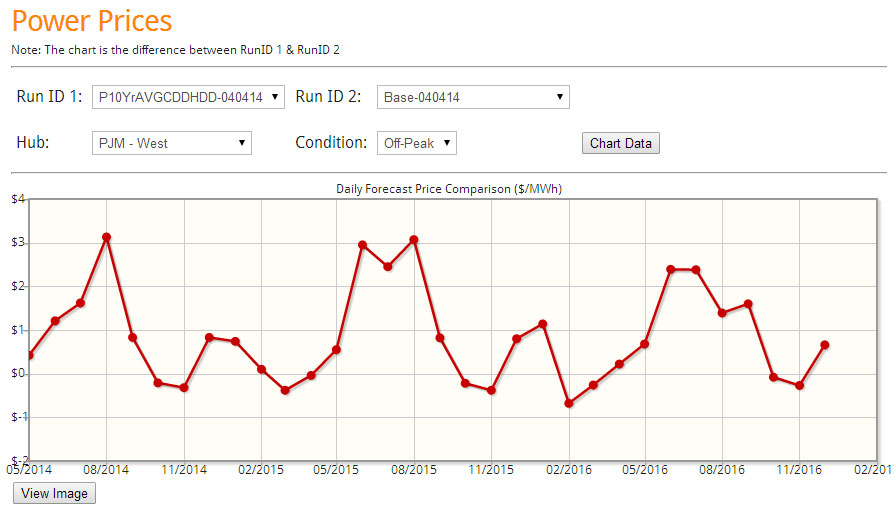
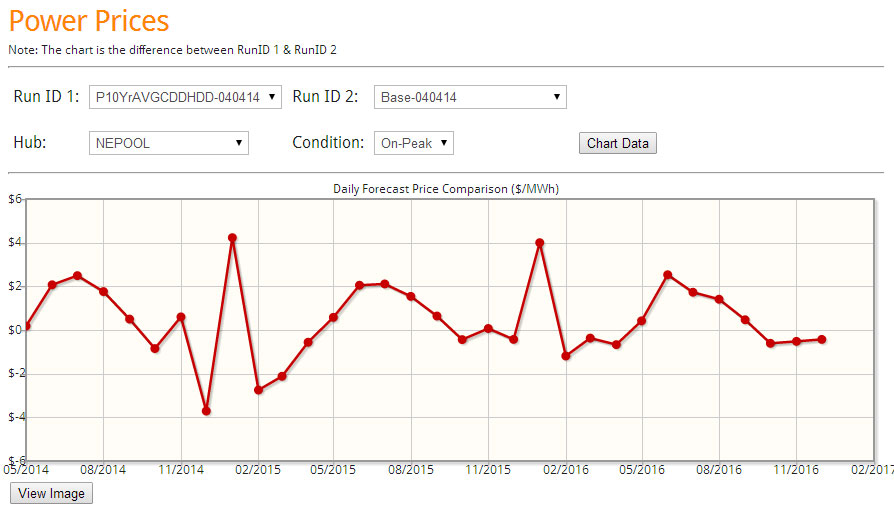
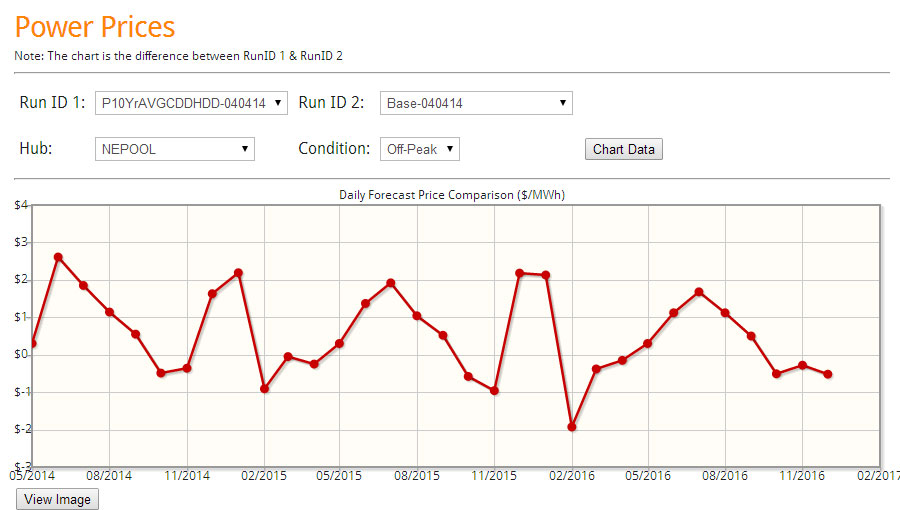
The 10 year average is clearly warmer than the NOAA normals. The impact on our base case in our Power Market Analysis (PMA) product shows a significant impact on the power markets. This translated to natural gas demand in the power sector rising 8% compared to the base case for this summer. Winter is essentially the same.
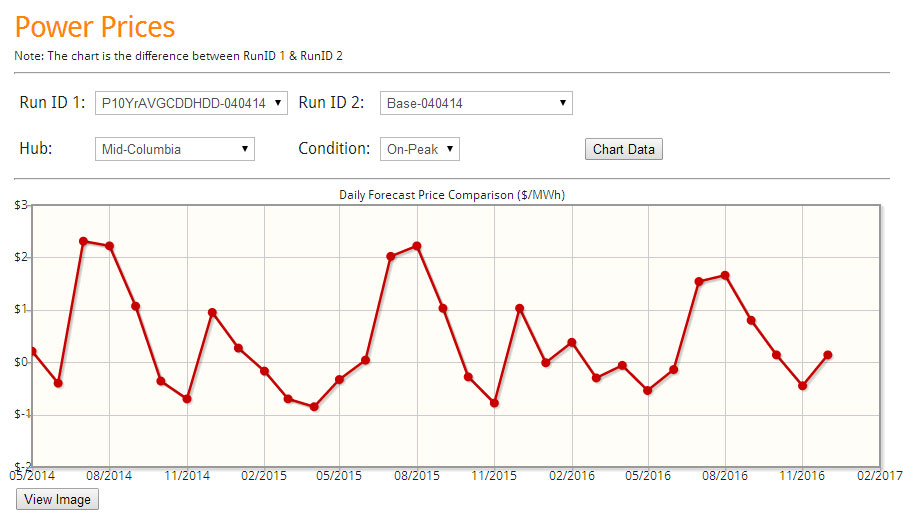
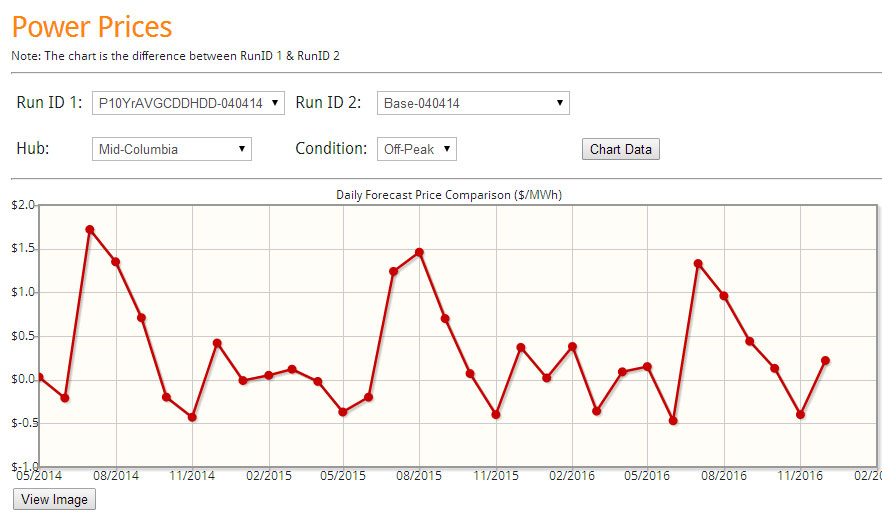
Power prices are significantly impacted by the weather change in certain regions. The below figures are screenshots which come from our online interface for our Power Market Analysis (PMA) subscribers. Each day the model dispatches the entire N. America based on the latest future markets price for coal and gas. Daily files are produced each morning similar to the above graphs. Plus the online interface allows users to quickly compare various runs. In this case, we are comparing the 10 year average weather vs. the Normal weather supplied by NOAA.
Many more regions are available to compare. In addition to power prices, there are comparison available for coal and gas consumption and input price comparison. Easy drop downs allow one to see how the future markets have impacted the power markets. PMA subscribers get access to the files including a complete analysis of 2015 and 2016 comparing the NOAA normals vs. 10 year average.
Soon, PMA subscribers will get a complete analysis of the last 10 year weather. Each year will be individually analyzed allowing subscribers to be able to choose analog years to represent the forecast.
PMA subscribers get the online access, the daily files, and the study files. In addition, prime members receive-at no additional cost-reports such as the Summer 2014 Outlook report , the recent briefing on what is causing the gas demand drop, and where it is coming from. Subscribers also have the opportunity for free private consultations. Discussions can range from answering more detailed questions on the studies to discussing potential scenarios of the future.
Please contact me to schedule an online demo meeting[email protected] or 614-356-0484
Your Inspired Energy Consultant,
David
David K. Bellman
Founder & Principal
All Energy Consulting LLC
“Independent analysis and opinions without a bias.”
614-356-0484
[email protected]
blog: https://allenergyconsulting.com/blog/category/market-insights/


