Winning Power Trades Identified by PMA

Many have given up on power trading due to various reasons from new banking regulations to limited volatility over the past few years due to gas prices. However as many leave the market, there is much opportunity being created in the market place. The power markets are vast and complex requiring a comprehensive energy background to truly understand the inner workings. With many years and significant market knowledge, Power Market Analysis (PMA) was developed to help unlock the opportunities in the power markets. The following will present post analysis of June trades and an example value of PMA.
One of the latest tools within PMA is the power trade screener. The power trade screener is capable of processing the entire N. American markets and producing a table of trades given a set of criteria on the various dispatch simulations used in the PMA. The basic PMA offering is running three runs focused on power price volatility – Base, High, and Low power price cases. The formulation of these runs are available for subscribers plus can be customized for each client depending on location interest and volatility expectations. The current criteria for the screener is to find trades that in ALL three cases produce a result that lies on one side of the current forward curve. Therefore if all three cases are below the forward curve, it is a sell. And if all three cases are above, it is a buy.
On May 20th 2014, the following represented the power trade screener view examining On-Peak Trades for the month of June. (Click on Image to Zoom)
In addition to the power trade screener, the heat rate screener also shows the same June Sell alerts for those regions. (Heat Rate trade is Power Contract / Gas Contract – if you believe heat rates are going down you sell power and buy gas)
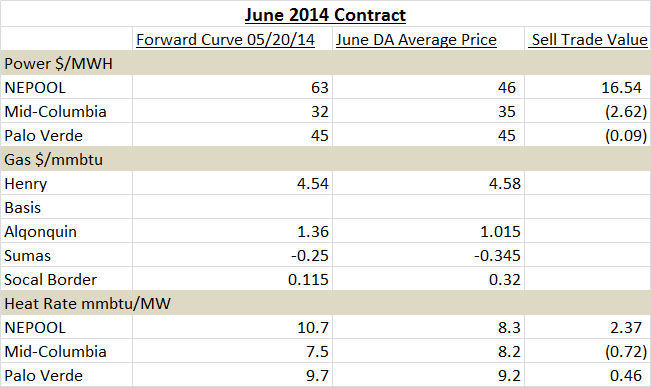
The results of these trade recommendations can be examined now. The below table show the results of those trades. (Click on Image to Zoom)
The power trades identified by the screener produce 1 out of 3 winning trades. However, if each trade was purchased in equal volumes the trades would have netted out $13.8/MWh. The best trade was NEPOOL. This is also supported by the backcasting of NEPOOL in the model being superior relative to other markets. On a heat rates basis, 2 out 3 trades would have been winning trades.
Everyday, this analysis is done. Users can learn the patterns and make the adjustments. There is money to be made with markets that are less liquid for those who have the financial and aptitude capabilities. The screener and the simulated runs can be customized for each client.
Please contact me for a demo – [email protected] – 614-356-0484
Your Ever Improving Energy Analyst,
David
David K. Bellman
Founder & Principal
All Energy Consulting LLC
“Independent analysis and opinions without a bias.”
614-356-0484
[email protected]
blog: https://allenergyconsulting.com/blog/category/market-insights/


