Modeling the USGC Refining Market
I had planned to continue to discuss the impact of oil prices beyond the obvious. In the first report on the impact of oil prices in the non-obvious areas, I discussed the likely impact to the Renewable Fuel Standards. I was hoping to follow up that report with the impact on condensate value as a result of the crude oil collapse. However, this has lead us into reviewing our refining models and also how the refining industry will likely have to evolve to handle the RFS.
As with many things in the energy market, you start with a hypothesis and investigate it only to be compelled to look at other areas in the market place. We are almost ready to release our first oil product, Oil Market Analysis (OMA), but first we had to make sure the refining models represented the USGC and was designed to incorporate the impacts of RFS. In this article, I have decided to go ahead and give you a tour of my problem solving methods when it comes to modeling USGC Refining Markets.
A key path for how I analyze the energy markets is to take a walk back in time.
Historical Changes in Refining
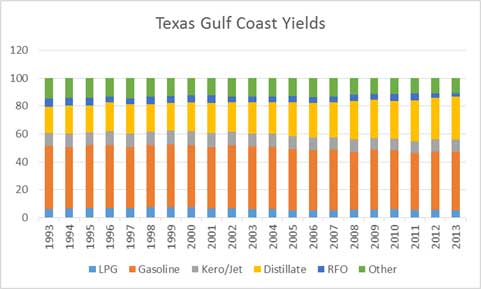
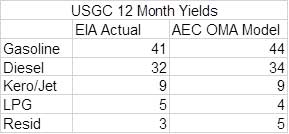
The yields of the USGC refiners have changed. Distillate yields rose while gasoline yields had the largest drop off.
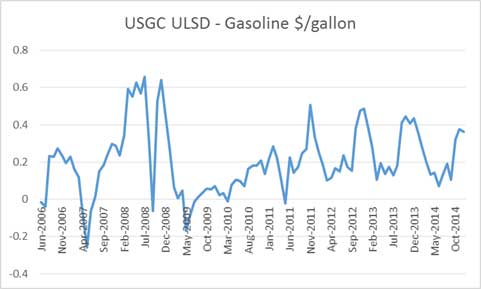
This was not a result of refiners’ strategy from the 90’s nor was it because of the crude slate changes. The primary driver for this change came from the market price change starting in 2005.
The EIA Annual Energy Outlook (AEO) was forecasting distillate spread to gasoline to be negative until the 2010 AEO release. The current AEO 2014 shows the spread averaging over $0.3/gallon. As with all free markets, they adapt to the pricing incentive. This change necessitates the adaption of the USGC refining configurations. This is also one of the reasons condensates are poor crudes relative to other crudes in the market as the distillate yield is very small.
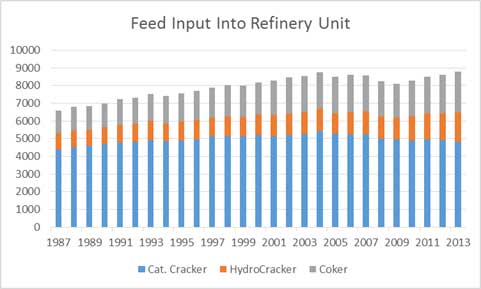
The quality changes did help the refineries produce more distillate, but many planned to expand and run their Catalytic Crackers and Hydocrackers. The price incentive has resulted in cutting back how hard those units run.
Calibrating USGC Refining Model
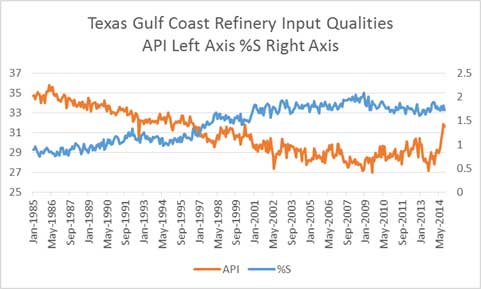
The first piece for calibration is putting a recipe of crude oil entering the USGC cracking and coking refineries. The average API for the last 12 months average around 30.2 API and 1.7 %S. The import data shows the major importers of oil for USGC are the Saudis, Venezuela, and Mexico. A crude slate from each of the countries were selected. Most of the import volumes were sent through the coking refinery. For those not knowledgeable in refinery – all coking refineries do have “cracking” capability via hydrocracker or cat. cracker. A blend of LLS, WTI, Mars, and Condensate represented the domestic blend. The volume on the domestic side went through both a cracking and coking refinery. The final recipe produced an average 30.5 API and 1.7% S.
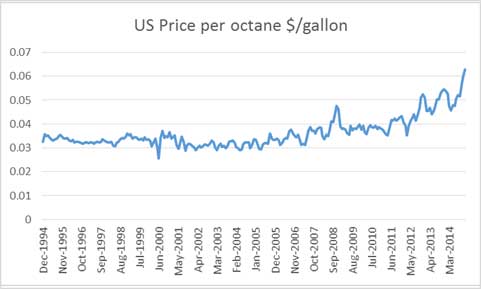
Both refinery configurations were then adapted to produce similar yield seen in the market place. The refinery levers represented modification in cuts going into the various units along with conversion capabilities. We also looked at the market signals from octane values to maximize the refinery capability to produce high octane components.
Octane pricing is a story in itself. The increase in value corresponds with the increase in condensate production. Condensates typically produce low octane products – another issue for condensates.
The final production of our represented cracking and coking unit in the USGC produced the following yields compared to the actual market production.
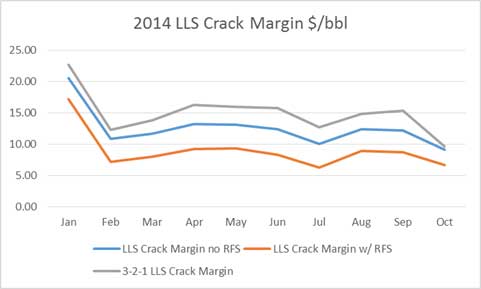
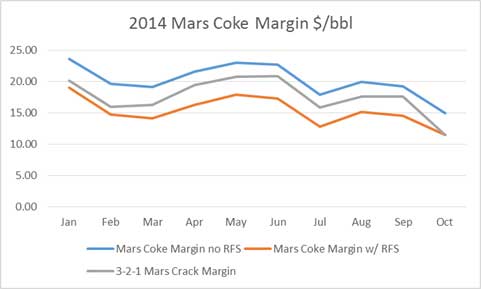
We then review the historical refining margins produced by the model depending on configuration and crude oil. The issue is whether we account for the ethanol requirement. As a crude produces more gasoline, the requirement for ethanol purchases are needed. Balancing some of the cost is ethanol octane is at 115 vs. 87 spec. For comparison, we use the simple 3-2-1 crack spread commonly used in the market place ( [2 x Gasoline Price + 1 x diesel]/3 – Crude Reference Price).
The yield and final market margins are the key step to how well your model is performing. Similar to our extensive work in calibrating our power models, we put the same effort into the refining models. We believe in transparency and show all our calibrations. As with any model, one can continue to improve upon it over time, but we will not be stuck in analysis paralysis. For vintage #1, we are pleased with the results.
Work in Progress
The results are promising. We will be filling our yield tables with various crude assays. The outcome of the work – Oil Market Analysis (OMA) – will produce monthly market expected refining margins based on the future markets. There is no need to wait for your consultants to put out a report days to months after the market has moved. OMA will be updated at the end of every business day keeping you on top of the market changes. The analysis will indicate the expected refining margins for gulf coast refiners. This will be helpful in guiding the valuation and expected earnings for USGC refiners.
An interactive website will be developed allowing users to select various crudes. This can be used to help guide crude oil optimization from pricing for contracts to informing buyers and sellers of arbitrage opportunities. The interface will also allow users to upload their own forecast of petroleum products or choose from All Energy Consulting custom forecast. With this capability, a user can customize and create endless amounts of insights. An end goal will also be to allow users to upload their own assays to be automatically run through our models. Currently, we can do this manually as this process requires some tricky programming to automate this feature.
Another thing we can offer is generating a model for East Coast, Midwest, and West Coast. The process and procedure will be similar to the above. Also, an international model could also be possible if we can find the information needed for calibration. Using this model, I plan to produce a report to calculate the value of condensates and further delve into the rapid growth in octane value.
Lots of fun analysis to do – who needs to sleep or eat?
“People who love what they do wear themselves down doing it, they even forget to wash or eat….When they’re really possessed by what they do, they’d rather stop eating and sleeping than give up practicing their arts.” Marcus Aurelius, Meditations
Your Tireless Energy Analyst,
David
David K. Bellman
Founder/Principal
All Energy Consulting LLC- “Adding insights to the energy markets for your success.”
614-356-0484
[email protected]
@AECDKB


