OPEC Decision Expected and Justified

OPEC meeting went as expected. There was no formal agreement to cut production in the first meeting since the price correction. This part is very similar to 1998. Prices did their thing by falling down and now slowly rebounding. OPEC is making the decision they are not the marginal barrel. Unlike their decision in 1997, they are likely right. Time is the key to how this all unfolds. The daily and weekly gyrations of crude oil prices are made by traders who believe they are able to read the dynamic tea leaves. The story of the oil markets can be explained by examining the details in the demand and supply fundamentals from the past and now.
Supply
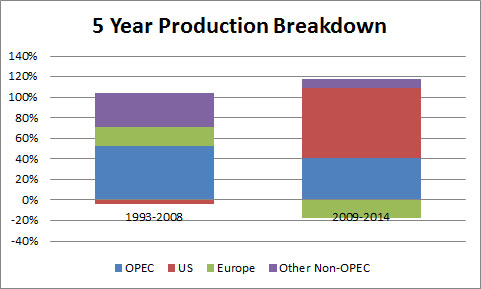
From 1993 to 1998, Non-OPEC production grew almost by 10% with OPEC growth in production nearly 20%. In addition, the Non-OPEC production outside US and Europe represented the majority of the Non-OPEC production increases. This is much different than 2009 to 2014 figures. Both OPEC and Non-OPEC production grew close to 8%. The majority of the Non-OPEC production growth came from the US. The dynamics of the increasing production will lead to a different result compared to 1998.
In 1998, most of the battle of production/market share was battle within the organization. The Non-OPEC production was coming from a diverse group with Europe production gains representing the largest group. Non-OPEC gains were coming from some significant finds which took a large capital cost to develop and was going to take many years to fully hit the production peaks. OPEC tried to hold the line, but they were only going to capitulate themselves. The Saudi’s showed the world a glimpse of producing oil near the kingdom marginal economics. This was too painful for many of the members and they succumbed to over producing their quotas which realigned the market over many years given the growing Non-OPEC production.
In 2014 most of the production gains is resulting in OPEC market share eroding in the largest oil demand market. This is no longer a battle within the organization. The marginal economics for this increasing production is much higher than in 1998. In addition, the profile of this production requires continual investments versus large capital outlays to maintain and increase production. This very fact will create a dynamic response to price which was missing in 1998. This is not a cure for a rebound in price over the next few weeks to months, but it will be a response which could not have occurred in 1998 without OPEC coordination.
Demand
The demand picture has some similarity between 1998 and now, but there are some distinct differences, just like in the supply picture. The similar aspect is the fact that the first sign of market weakness stemmed from the demand concerns in the Asian economy. The distinct difference is the development of the demand concern is much different.
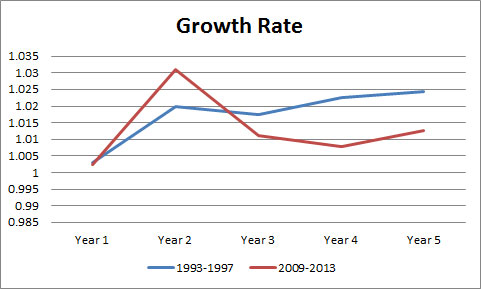
Going into 1998, world oil demand growth was averaging a 2% growth per year with Asian demand growing by over 5% a year. China was growing nearly 8% a year. Most pundits at the time were expecting continued growth in the region. The problem I identified early on is the massive growth year after year was leading to some very large absolute numbers. In examining historical growth of developing countries, it showed eventually a country demand growth slows down after 5 to 10 years of strong growth as infrastructure is needed to expand further. The Asian financial crisis created a dramatic shift in demand expectations. Oil producers were caught off guard as capital was spent in expectations of demand growth.
Going into 2014, world oil demand growth was only averaging 1.3% after the 2008 financial crisis. Asian demand was averaging 3.5%. World oil demand growth from 2011-2013 has averaged only 1% a year. European petroleum has been in a downward spiral since 2007. Unlike 1998, no one should be surprised with lackluster demand growth. Given the dismal demand numbers for the past few years, demand is likely to be more surprising than a production correction.
Putting it All Together
With slowing demand growth and increasing production, a price correction becomes inevitable. The price is now trying to find the price point to slow production and/or increase demand. Production is going to react faster than demand. OPEC made the right decision to let the prices come off. If they cut their production it would have created a dislocation in the supply curve and ultimately lead to a reduced revenue stream. In 1998, this strategy would not have worked given the production competition was largely within the group and with the Non-OPEC production coming from large capital projects. This time, we have a market with production coming from N. America which is dependent on continued capital investment to maintain production. We expect the market to find enough marginal wells in US and Canada around the $60-$80/bbl range to balance the market for the next few months. After that, I expect the market to recover as demand will naturally rebound given the 20-30% price decline. I think, by next year, we will see demand much stronger than the current IEA outlook.
Some have asked why I skip the 2008 price correction. The 2008 price change was more of a function of the global economic crisis, and I consider this an outlier in terms of fundamental supply/demand issue in the oil market. However, in the presentation, I do cover the 2008 peak price and the actual prediction I made in calculating the maximum peak of the oil prices – $145/bbl (prediction) vs. actual of $147/bbl.
As noted, in my other articles on the oil markets (Crude Oil Markets not 1998 & Crude Oil Collapse) I have a complete presentation that I can present to you and your team offering a unique perspective on the oil market. We take the time to truly understand the past so we can appropriately reflect on the future. Please do consider All Energy Consulting to offer your team insights on the oil markets. The presentation includes price forecasts and explanations including a discussion on refining margins.
Your Over 10,000 hours of Analyzing the Oil Markets Energy Analyst,
David
David K. Bellman
All Energy Consulting LLC- “Independent analysis and opinions without a bias.”
614-356-0484
[email protected]
@AECDKB
blog: https://allenergyconsulting.com/blog/category/market-insights/


