Procure enough fuel this winter for your generating asset?
Fuel procurement for power plants has always been a tricky game, particularly when you add the element of cost. Buying too much fuel makes you look foolish and not buying enough makes you a gambler. Finding that sweet spot and the ability to justify the level of procurement is part of the Power Market Analysis (PMA) package. In this article, we will demonstrate the process of using PMA to find the right volume of fuel to purchase.
We randomly selected WS Lee coal plant in South Carolina and pulled out all the information from our 54+ scenarios we produced for this winter outlook. The key variables we examined in this example were load and gas price changes. PMA is designed for customization, so you can create custom cases for nuclear outages, hydro capabilities, fuel deliverability issues, coal pricing, etc…
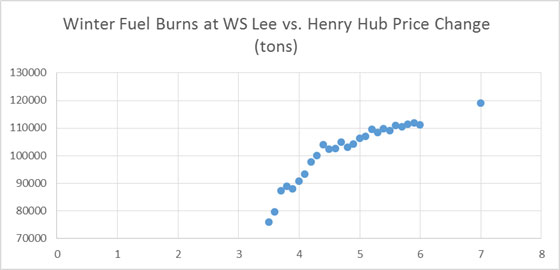
For gas price impacts on fuel consumption, we examined Henry Hub prices from $3.5-$6/mmbtu and added a stress point of $7/mmbtu. The graph below shows the amount of tons of coal consumed in the various price changes. The reference case used a varying strip (forward curve 9/24/2014) averaging $4.03/mmbtu.
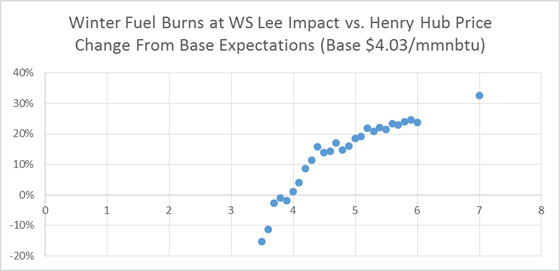
We like to look at it as it relates to the Base run. This view enables you to quickly assess the changes as function of a reference point. This also allows one to recalibrate to your actuals as the model is only a proxy and does not contain your exact cost structure and operational details. A custom PMA can be created to emulate your units cost and operational details. The percentage view gives a good assessment and allows easy comparison to other variables without worrying about the exact numbers. Based on the below graph, we can conclude the risk of gas prices moving up $1/mmbtu could lead to a 20% increase in WS Lee fuel consumption.
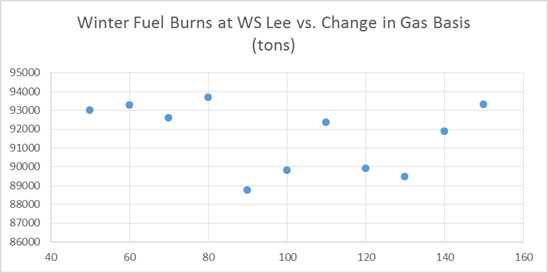
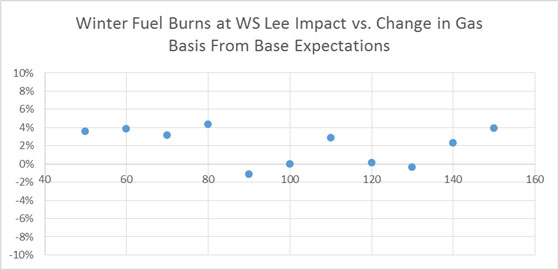
Another gas price impact view was to change the basis price. In this example, we took basis around the country and multiplied it by a percentage. So in the case labled 50 – we multiplied the basis spread by 50% making it half as small as the reference point. Inversely the 150 case makes it 50% higher. The absolute and percentage cases are shown below.
Given the facility is located in S. Carolina, it is reasonable to expect this unit to be less sensitive to basis versus Henry Hub changes. WS Lee, from this analysis, does not have to worry about basis causing significant variance in fuel consumption. However it is prudent and reasonable to be prepared to procure ~20% from base expectations given the real possibility of $5/mmbtu Henry.
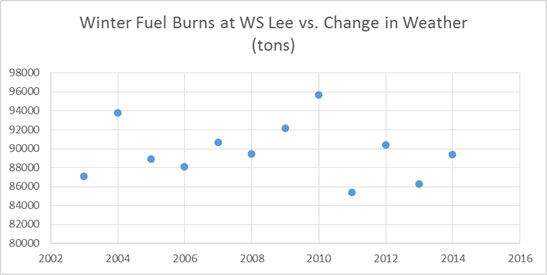
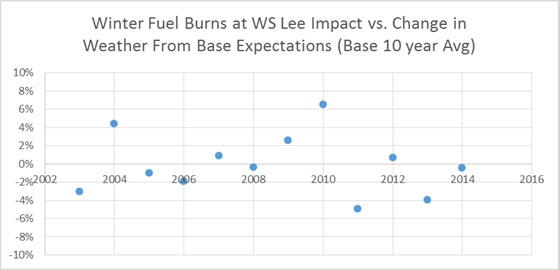
For load we looked at the last 12 years of actual weather and simulated each year into the model. The following graph shows the changes in WS Lee coal consumption and the percentage from base.
Once again, because we chose WS Lee a coal plant in S. Carolina – weather variance in the winter time is less important relative to a gas unit in the Northeast. However weather would support procuring almost 10% above base expectations given a recent actual weather event (2010) did necessitate 7% more burn from the 10 year average.
Several more custom runs could be generated from nuclear to coal outages to coal pricing (transportation & mine price) that would aid in the justification of the level of coal procurement of WS Lee. Using this example, a clear and precise justification can be made to procure somewhere between 10-20% more than the base expectations given the weather and natural gas market variance.
This demonstration used the analysis for this winter season, but this could easily be done for many months to years out. PMA can easily be used as a third-party validation to your procurement process. Avoid any accusations of being a fool or a gambler – sign up to PMA and start creating your custom run. PMA is more than just output – it is a proven process and platform designed just for you. We give enough customization, but allow you to still refer to it as a third-party source due to our involvement in the process.
Your Looking Out for You Energy Analyst,
David
David K. Bellman
All Energy Consulting LLC- “Independent analysis and opinions without a bias.”
614-356-0484
[email protected]
@AECDKB
blog: https://allenergyconsulting.com/blog/category/market-insights/
Crude Oil Collapse?
A sustained collapse of crude oil is too early to call. This is speaking from the one who is not shy to call crude oil collapse – Front Page USA Today March 10, 1998. The dynamics are different than it was back in 1998. Right now we are entering a shoulder period of oil demand where you have reduced driving and limited oil demand for heating purpose. Add to this the global economic concerns; you have the perfect recipe for driving the oil prices down. The key difference from 1998, which still has limited discussions from oil pundits, is monetary policy. I noted this concern back in 2012 in my CERAWeek 2012 summary. There is a fine balance between correlation and causation. The strengthening of the US dollar of recent is occurring simultaneously with a fall in oil prices. In 1998, the US dollar index was much higher than it is now and was not declining during the collapse.
The monetary strength of US dollars is important as the buying and selling of crude oil is typically done in US dollars. Therefore the ability to buy global widgets, if you are a producer, will be a function of where the currency is going. The OPEC members are seeing a loss in revenue as crude oil falls, but their ability to purchase the same amount of widgets is being buffered with a strengthening US dollar.
The global race to negative currency continues as the US experience documented that a printing of currency can actually lead to recovery. Now with the US stock market heading down, will the US policy of leaving no investor behind force another round of the very successful quantitative easing (sarcasm – see my article on Quantitative Easing and Climate Change)? If we do see a FED reaction to the strengthening of the dollar, I suspect we will see a rise in oil prices as a natural rebalance or in the form OPEC reacting to a drop in widget purchase capability.
Clearly, fundamentals of supply and demand of crude oil should and will dominate the crude oil price. But, I believe monetary policy deserves some more discussions as a strong influence to oil pricing. The supply /demand trend does show potential for a significant weakening, but it is not the best time to do ones balance as fall and spring season can result in wild oil demand swing. The oil markets given the growth of various alternatives of fuels (e.g. electric, ethanol, natural gas) will result in increasing demand volatility producing significant inter-year price swings. Storage will increase in value as selling in shoulder months will likely worsen in price versus peak periods of oil demand.
Planning to be in Houston the week of the 27th. Please let me know if you are interested to discuss the energy markets- send me an email and we can schedule a time to meet – [email protected]
Your Keeping an Eye on the Oil Markets Energy Analyst,
David
David K. Bellman
All Energy Consulting LLC- “Independent analysis and opinions without a bias.”
614-356-0484
[email protected]
@AECDKB
blog: https://allenergyconsulting.com/blog/category/market-insights/
Best Winter Power Trade
I have been asked many times what the best trade is for this winter based on our product Power Market Analysis Near-Term (PMA-NT). PMA-NT, unlike other consulting products, is designed to have a business partnership relationship vs. typical vendor product relationship. We work with our clients to design and build custom forecasts to the point they feel PMA-NT is an augmentation of their analytical department. The product is designed to be customized by allowing clients to feed in their own weather forecast to commodity prices. Essentially, any input into the power model can be overwritten in order for you to have a smooth transition from what you are doing now. In addition, the output can also be customized.
The initial setup for PMA-NT does hold significant value as a trading and hedging tool. It was designed based on the 12+ years of power modeling experiences from utility trading and planning perspective to hedge fund trading of power and gas perspective. However it takes a holistic approach in dealing with risk. For many, this will be fine. For those of you focused in a particular region, you will likely not want an extreme weather case for N. America, but an extreme case for your region of interest. Every region in the US holds unique characteristics. Power trading in the west will likely want to have hydro sensitivities as part of their high and low cases. Those in the East will want basis sensitivities. The initial setup does neither of these as it takes a generic view, but the capability is clearly possible. Our Outlook runs (50+) do incorporate these risk factors, but the day to day running of the initial setup of PMA-NT does not since the goal is to get an overall understanding on the markets with weather, gas prices, and outages being the prime drivers. Once again, PMA-NT is designed for you so you can have a day to day run with your focused area with your data feed. When you succeed, we succeed. That is the core of PMA-NT. We believe in our working relationship model so much we are willing to offer a no-cost solution to a few candidates as long as we get to share in the profitability of the trade book.
With that being said, the initial setup best trade for winter from my perspective is to buy the December On-Peak spread of AD-Hub minus NYJ (Buy AD-Hub and sell NY-J). I prefer spreads as spreads mitigate some risk and I am not as risk averse as perhaps others are. I prefer spreads as spreads mitigate some risk and I am not as risk averse as perhaps others are. My criteria for the best was the trade with the most to gain with limited risk.
Justification: Last winter’s extreme weather seems to be priced into December – NYJ power prices (Dec13= $73/MWh vs. Forwards Dec14(10/08/2014)Avg=$88/MWh vs 2010-2013 Dec Avg=$63/MWh). Whereas AEP-Hub prices seem to be less weather impacted from last year (Dec13 Avg= $41/MWh vs. Forwards Dec14(10/08/2014)Avg=$44/MWh vs 2010-2013 Avg=$40/MWh). The extreme cold from last winter was more apparent in month January-March, which is surprising to see so much strength in NY-J this December. From 2010 to 2013 December spread between AD-HUB minus NY-J went as wide as $-39/MWh in 2010. If December does get cold, there is much more run-up room for AD-Hub than NY-J. Therefore, the spread will improve from its current $-44/MWh. However, if the winter is more normal, or even mild, expect NY-J to collapse more than AD-Hub – once again the spread will gain. There are areas to investigate, such as the possibility of operations at power plants this winter being better than it was last winter – as discussed in my previous article. This would act against the spread play, given PJM has more diversity of plants to improve upon the cold weather operations compared to New York. Entergy’s Vermont Yankee nuclear plant will not be available this winter as it is being decommissioned. This is in our initial setup, but the retirement is not expected till after the end of this year. The model does not have a sell on NY-J going into Jan perhaps because of this issue. From the winter outlook (50+sensitivities) only the basis moving up another 50% would get near the forward markets spread. Before setting forth to buy the spread, I suggest running a few more sensitivities, such as an earlier retirement of Vermont Yankee, and having a dialogue about all the factors that could lead to further widening of the spread. This is the working relationship I am describing for clients of PMA-NT.
At All Energy Consulting we understand supplying you with forecasts is only one step of the process and may even be the smallest value of the process. The real value comes from the interaction with us and the willingness to explain the process and have frank discussions on the results. We believe no other consulting product will offer this unparalleled experience. You will work directly with me, an experienced analyst from one of the top energy consulting company (Purvin & Gertz / now IHS, Deloitte) and one of the largest utilities in the industry (American Electric Power (AEP)). PMA-NT is not just a product, but more of a service. We want to work with you in understanding the volatile power markets.
This also applies to our long-term service PMA-LT. We can work with you to understand the impacts of various policies and develop a cohesive resource plan.
Please contact us at your earliest convenience. We look forward to beginning the conversation.
Your Willing to Work with You Energy Consultant,
David
David K. Bellman
All Energy Consulting LLC- “Independent analysis and opinions without a bias.”
614-356-0484
[email protected]
@AECDKB
blog: https://allenergyconsulting.com/blog/category/market-insights/
What are the risk factors for AEP, CPN, D, SO, EXC, NEE, DUK, NRG, TVC, ETR, and more this winter?
Going into the winter, the key variables that drive the profitability of a generation portfolio will be the price of Henry Hub, Basis, and Weather. Our Winter Power Outlook dispatches the entire N. America power system. Every asset is modeled. We have pulled together the top 10 generating portfolios under our 50+ cases to show you the impact of those variables. The information is not perfect in the sense that we do not know exactly what they have hedged or not hedge – nor do we adjust for any potential bi-lateral deal. However, the output represents the free market performance which will indicate key risk factors in how their portfolio will perform. If you have a particular set of assets or just one unit you are interested in, we can pull that information for you.
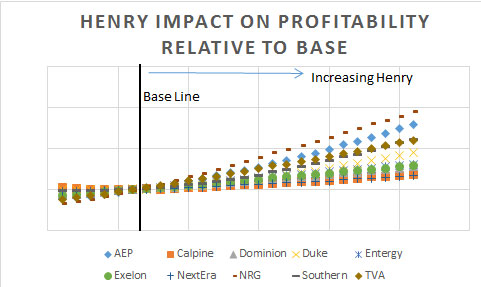
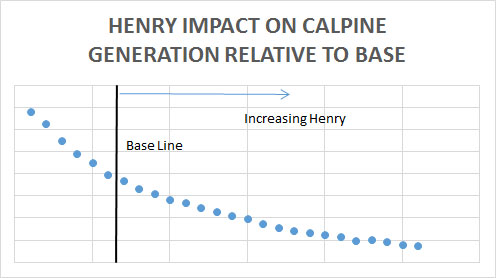
Expectations on Henry Hub are narrowed around $4/mmbtu. However, last winter, we saw Henry Hub climb to over $6/mmbtu in the winter. Running over 28 simulations of Henry Hub, the redacted (sign up to receive the Winter Power Outlook to get all the data behind each figure) figure below shows the impact of the 10 generation portfolios.
The most sensitive to the price of Henry Hub is NRG followed by AEP. NRG could potentially see an upside of almost 100% if Henry Hub prices move to our higher end range. The least impacted by changing Henry Hub are NextEra and Calpine fleet. The Calpine slope is interesting as it seems somewhat counterintuitive. Examining Calpine fleet shows that they have the lowest gas heat rate (efficiency of plant – low HR= highest efficiency) fleet ~7.8 mmbtu/MW. In addition, their fleet is 90+% gas compared to the next highest at 60%. The combination does not help them if gas prices were to stay low. Their units do generate more as the gas prices go down, but this does not lead to greater profitability – see figure below. The good news for the generating assets is the slope of profitability is asymmetrical – more upside than downside. This logic has supported some lack of action to hedge power. However, there is always a point where some hedging would be logical particularly for regulated assets and those trying to manage earnings expectations. AEC can help identify those points.
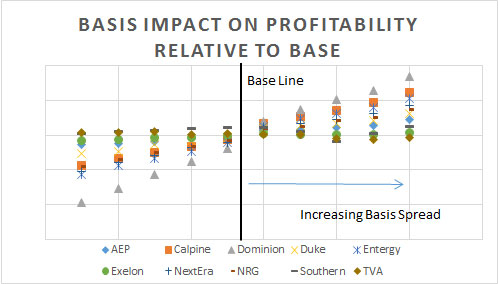
Reviewing the basis impact shows the risk reward as being much more symmetrical. The redacted figure below shows Dominion generating portfolio seeing the most impact if basis were going to change followed by Entergy. This makes sense for both given their exposure to the east basis. The least impacted by basis change are TVA and Exelon. Given this knowledge, Dominion and Entergy should be trading/hedging themselves for basis risk.
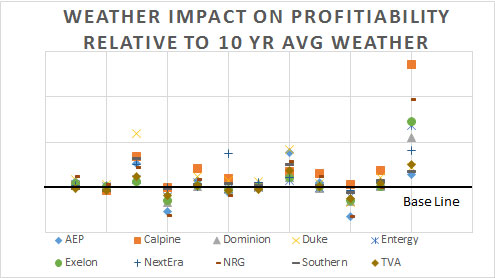
In terms of weather risk, we ran the last 12 years weather pattern in our models and compared it to the 10 year average. The following redacted figure was produced. In terms of weather risk, it is also very asymmetrical as in Henry Hub. In general, there is more upside on a cold winter than downside on a warm winter. However, in AEP’s case, that difference is very narrow given the historical weather pattern. They almost have as much to lose on a warm winter as they can gain on a cold winter. Calpine can produce the greatest gain if weather were to duplicate last year’s pattern. The fleet with the smallest standard deviation from the 10 year average weather pattern was Southern. This makes sense given the geographical location.
Subscribing to the Winter Power Outlook can get you all this analysis. All this analysis is available to you for only $3000. We will also supply a free 1 month access to PMA-NT. Plus if you are the first five customers you can get a custom scenario based on the permutations already used. You can create your very own extreme case (e.g. Basis up 30%, 2013-2014 Weather, Plus Henry at $5.5/mmbtu, double forced outage rates). There is no other place to get so much information for so little. The report will be even larger and more comprehensive than the Summer Outlook we produced this year. If you take the time to review and understand the report, you will be fully prepared to understand the risk and key variables driving the power markets this winter.
The above analysis can be customized for you. If you want to understand how a generation portfolio may be impacted by weather, price, load, environmental policy, hydro generation, nuclear outages, etc…we can process it through our PMA models to get you your portfolio outcome. Output can range from profitability, fuel consumption, generation by month. The time period can be as little as one month to as long as 20 years.
Please call or email to sign up for the Winter Power Outlook, PMA-NT , PMA-LT or a custom run. [email protected] or 614-356-0484.
Your Grateful Energy Consultant,
David
David K. Bellman
All Energy Consulting LLC- “Independent analysis and opinions without a bias.”
614-356-0484
[email protected]
@AECDKB
blog: https://allenergyconsulting.com/blog/category/market-insights/


