Assessing the Cost of EPA’s Clean Power Plan
In order to understand the following, one needs to have read the Clean Power Plan and/or read the 3 summaries I put together of the Clean Power Plan (Paper #1, Paper #2, Paper #3). Reading those three will allow you to get an understanding of the areas of cost that I plan to discuss below.
The Clean Power Plan notes the cost metrics in consumer terms: “Under Option 1, average nationwide retail electricity prices are projected to increase by roughly 6 to 7 percent in 2020 relative to the base case, and by roughly 3 percent in 2030 (contiguous U.S.). Average monthly electricity bills are anticipated to increase by roughly 3 percent in 2020, but decline by approximately 9 percent by 2030. This is a result of the increasing penetration of demand-side programs that more than offset increased prices to end users by their expected savings from reduced electricity use.”
In demonstrating the cost metrics in utility terms, they offer a significant amount of disclaimers “The compliance assumptions – and, therefore, the projected compliance costs – set forth in this analysis are illustrative in nature and do not represent the full suite of compliance flexibilities states may ultimately pursue. These illustrative compliance scenarios are designed to reflect, to the extent possible, the scope and the nature of the proposed guidelines. However, there is considerable uncertainty with regards to the precise measures that states will adopt to meet the proposed requirements, because there are considerable flexibilities afforded to the states in developing their state plans.”
The EPA estimated compliance cost states “The EPA projects that the annual incremental compliance cost of Option 1 is estimated to be between $5.5 and $7.5 billion in 2020 and between $7.3 and $8.8 billion (2011$) in 2030, including the costs associated with monitoring, reporting, and recordkeeping (MRR).” The key word in the statement is annual. These costs can be expected each year. The EPA noted this is based on the difference to their base case, but was not explicit in their base case assumptions.
There are significant moving blocks, and the ability to model all of these options take time. In order to speed up the process, I approach the problem focused on the existing fleet and current load projection for 2016. Using 2016 will essentially show the remaining fossil fleet that is likely going to be impacted by the Clean Power Plan. This part of the analysis is centered on BSER 1 & 2 (plant efficiency improvement & redispatching). The targeted CO2 values for each state existing fossil fleet were extracted from the EPA model assuming BSER 3 & 4 (Non-Carbon Generation and Demand Side Efficiency) will deliver as EPA projected. Out of all the blocks, BSER 1 & 2 are the most tied to the market place given their impact is on the existing fleet. The BSER 1 & 2 represents almost 40% of the total rate reduction.
The models I am using are very sophisticated and robust. These models are used to make financial decisions in the current market place for both gas and power markets through the product line – of Power Market Analysis (PMA). The base dispatch model is the AuroraXMP model by EPIS. The entire N. America is being modeled. A significant amount of work was needed to produce a model that is applicable to today’s market.
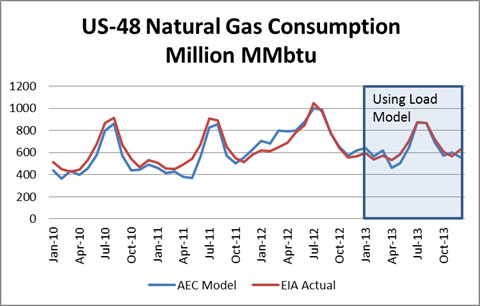
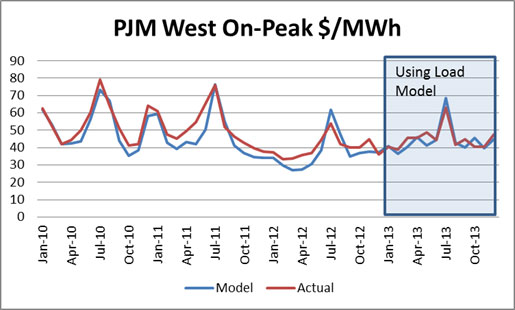
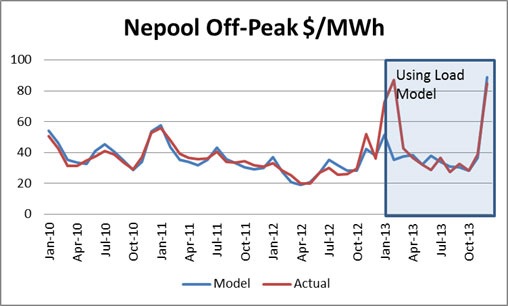
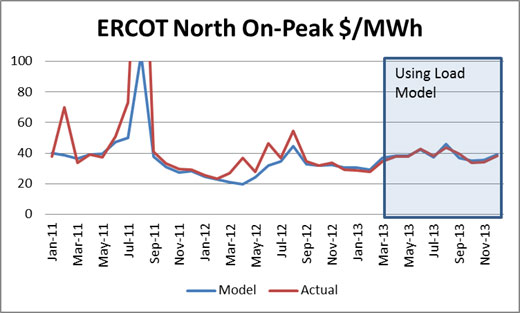
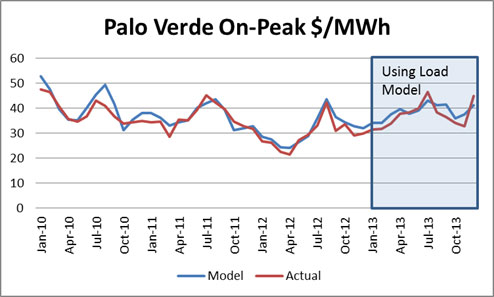
Validation of the model is continually being done. If your consultant is charging to see validations or has not done one in some time I would be skeptical on the results. Below are a few graphs validating my process – many more available per request:
These large models as used by the EPA – EPA used the Integrated Planning Model (IPM), developed by ICF International – I have always been interested in their ability to backcast the actuals on a monthly basis using their forecast methodology. Without first presenting and establishing the model tendency how do you know that the model can forecast? It may not be the model, but the data inputs the user is applying to model which could result in wrong output. Many large models typically make the excuse they are not interested in the daily or monthly changes, but want to show the “high” level impacts. I would be cautious on the ability to calculate economics in the market at that point.
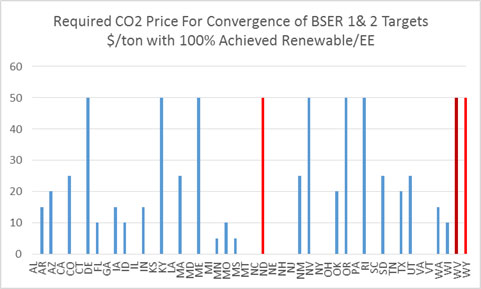
The simulations were all based on the forward curve prices published on June 5th 2014. After around 14 iterations I was able to reach an acceptable convergence to produce the state rates suggested by the EPA through re-dispatching with individual state CO2 price being the variable to target state rates. There were 3 states that could not converge to an acceptable level so I left them at the max of $50/ton. There are 21 states where the price of CO2 was essentially zero – see chart below. Significant renewable and DSM and the retirement of coal units in these states drove them to essentially not have to alter their dispatch to achieve the state targeted CO2 rate.
In addition to EPA “optimize” case, I ran a case with only 60% of the renewable and DSM/EE. This is reasonable case in the sense the EPA guideline for BSER 3 & 4 are based on non-empirical goals (State Renewable Program Goals and Other State Experiences). I discuss the concerns of this method in Paper #3. Nonetheless, I do believe more than half of the expectations can and will be achieved – hence I chose 60%. This obviously dropped the targeted rate with some as low as 60% of the initial targeted rate. In the 60% case there were 6 more states that hit the maximum $50/ton case. There were only 15 states with zero carbon cost – See Charts Below.
Note Illinois did not require any carbon cost in both cases. Ohio actually fared well because the utilities had to burn through many of their coal plants in 2012 even though it was uneconomical, and scheduled retirements in 2014-2016 help achieved the targeted rate. The big question for Ohio is can they achieve their renewable target. I have done a state by state report plus added a feature to be able to extract particular units within the state to inform you. A sample file for Colorado is available. If interested please send me your state(s) interest and the amount you are willing to pay for this highly informative report. Also add a note if you want a particular group of assets evaluated.
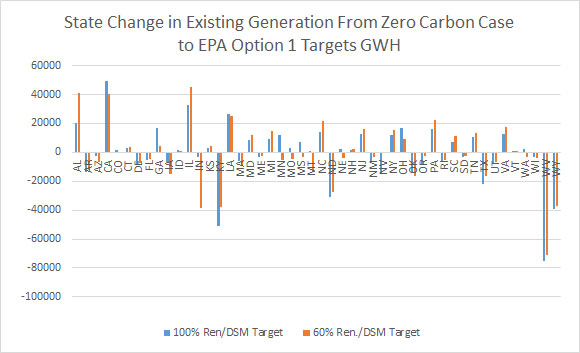
The runs did produce a list of winners and losers in terms of existing power plants. As an existing power plant you want to be in Illinois, Alabama, and California not Kentucky, Indiana, or West Virginia – See Chart Below
In theory, the quantification of just BSER 1&2 cost would be below the actual cost of the total Clean Power Plan. The other parts of the program involved new creation. In most cases, an existing already paid for resource cannot be economically challenged from new items including many DSM programs. The 2016 run already retires many of the uneconomical units. The below chart shows the impact of wholesale power prices as a result of “forcing” redispatching to achieve target.
Wholesale power prices increase 20% in the 100% BSER 3&4 case and in the 60% BSER 3 & 4 case almost 40%. The way power prices are set, the marginal unit sets the price for all units in a given hour. Therefore, even if you bid into the system at $5/MWh, if the marginal unit (the last MW to fill the required electric demand of the system) is $100/MWh, you will get $100/MWh. In a regulated framework, this is less important since the structure is built on cost and depending on if there are outside shareholder additional returns (8-15%). Given the EPA statement, “retail electricity prices are projected to increase by roughly 6 to 7 percent in 2020 relative to the base case” & “Projected wholesale electricity price increases over the same period were less than seven percent”, I am not sure they are appreciating the deregulation impact. The 7% does align with comparing my fuel cost from the increases seen in the various cases. However, I did not change the fuel prices even though EPA analysis did show this would likely happen – increase gas price and lower coal price. The cost world is generally gone in the generation space. Generators below the marginal power plant will keep all the gains vs. being satisfied with a cost basis. The box on de-regulation is open and not likely to come back.
Energy revenue for the entire system went up $130 Billion in 100% BSER 3 & 4 and $243 Billion in 60% BSER 3 & 4. There are still systems that are fully integrated therefore will not capitalize on the opportunity to charge more to the customer. There is no doubt the cost of the power price impact will be much greater than noted by EPA.
As pointed out several times, this is the piece involved in the existing fleet which is an integral part in achieving EPA Clean Power Plan CO2 rate targets.
There are several points made by the EPA alluding to cost being reduced due to energy efficiency – “Average monthly electricity bills are anticipated to increase by roughly 3 percent in 2020, but decline by approximately 9 percent by 2030. This is a result of the increasing penetration of demand-side programs that more than offset increased prices to end users by their expected savings from reduced electricity use.” This is true for some, but not all. The other half of the system (transmission & distribution) is still regulated. The programs are not free. They do cost money and must be paid for. The local distribution company can save when you are efficient in not causing large capacity payments and/or limiting inopportune times of buying power (high demand periods). This has been known for many years. As users become more efficient the regulated group still is promised the cost of operation. The only means of collecting the cost is charging users of electricity. As usage goes down, the cost collection goes down. Therefore, rates go up to compensate. The issue will become creating balance programs so that the wealthier who can afford the programs do not cause the rest of society to pay more. The regulated world is a zero sum game even more so without the generation piece.
It is easy to calculate the cost of the renewable piece. I have a state by state sheet showing the various targets set forth and calculating the cost using conservative estimates on the cost of wind and its performance. The renewable piece will be easily $200 Billion which comes out to be $11 billion a year. This makes this statement very confusing “The EPA projects that the annual incremental compliance cost of Option 1 is estimated to be between $5.5 and $7.5 billion in 2020 and between $7.3 and $8.8 billion (2011$) in 2030” Perhaps the rationale for difference is the base will already have that cost built in. However, with low gas prices and a lack of incentive, such as a carbon price, I don’t believe the renewable levels would be achieved to the extent the EPA is targeting. Even half the difference still shows the capital cost to be low. The DSM/EE programs do cost money. The higher power prices will cost the local distribution companies more and the generators who are left to compete are not going to send a bill that is cost plus.
Though the cost is higher than EPA projects, the benefits may still be there. In the next and final synopsis on the Clean Power Plan, we will review the benefits.
As noted previously, I have spent significant hours analyzing and modeling the Clean Power Plan Act with no payment from any source for this effort. The big driver in taking on this task is my personal intellectual interest. There is hope I can monetize some of my work. I do have the state by state report which I am hoping will be of interest – State of Colorado sample. Plus I can do a fleet analysis if you want to know how your assets will perform in this new world. I can also assist in developing a strategy to not only survive but to capitalize – where there is change there is opportunity.
Please do consider me for your energy consulting needs.
Your Inspired Energy Consultant,
David
David K. Bellman
Founder & Principal
All Energy Consulting LLC
“Independent analysis and opinions without a bias.”
614-356-0484
[email protected]
blog: https://allenergyconsulting.com/blog/category/market-insights/


