Extreme Weather Impacts to Gas Storage and Price

We have recently added a new feature in our gas model allowing users to upload their own forecast for the natural gas markets and to use the tool to produce your power sector demand. This is very beneficial for those who shape and produce their own monthly forecast of natural gas fundamentals.
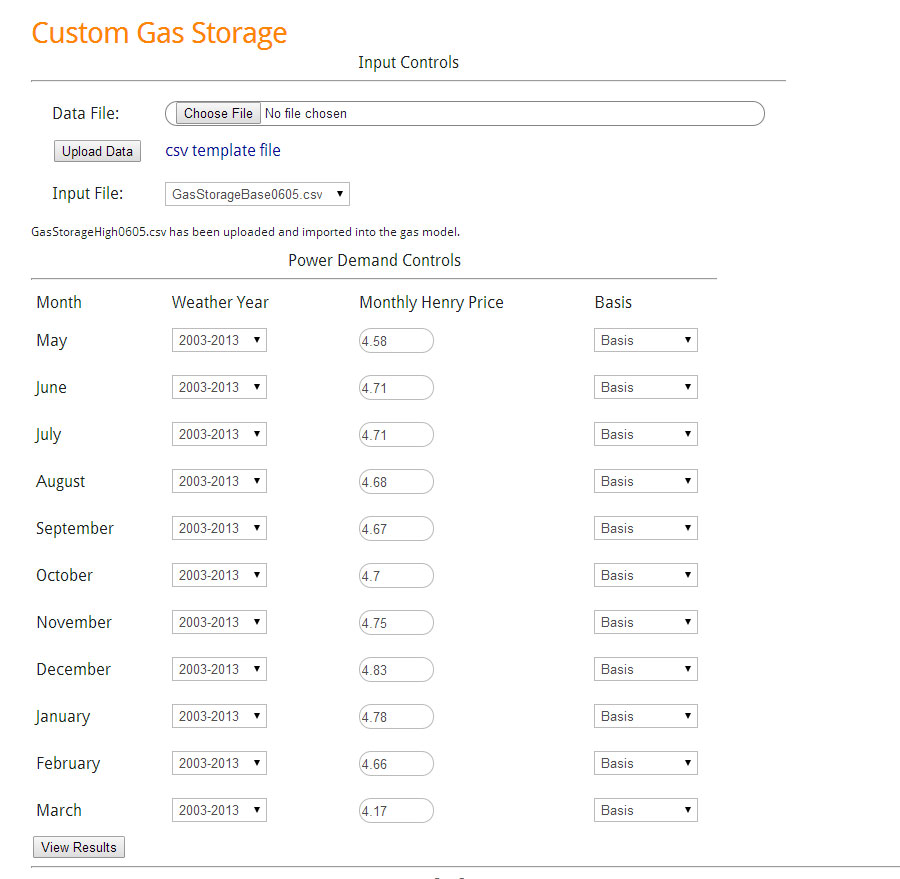
In this analysis, we will look at extreme demand cases as a result of weather and the impact it will have on gas storage and price. First, we need to establish a baseline to target an inventory level. For the baseline, production growth looks to be sustaining around 4%. I suspect this will hold given the price incentive. Net imports are up around 5% for the year and is projected to sustain. In terms of growth outside the power sector, demand is up close to 10%, but this is largely due to the weather extremes in the early part of the year. If you look at just May, which has more “normal” weather, demand is still up but only 7%. For the base run I sustain the 7% growth in demand. The baseline file was uploaded, and using the controls we set the price to the current forward curve strip (06/05/14) and used the average weather between 2003-2013. The below is the screenshot of the input setup.
Baseline Storage Inputs
(Click Image to Enlarge)
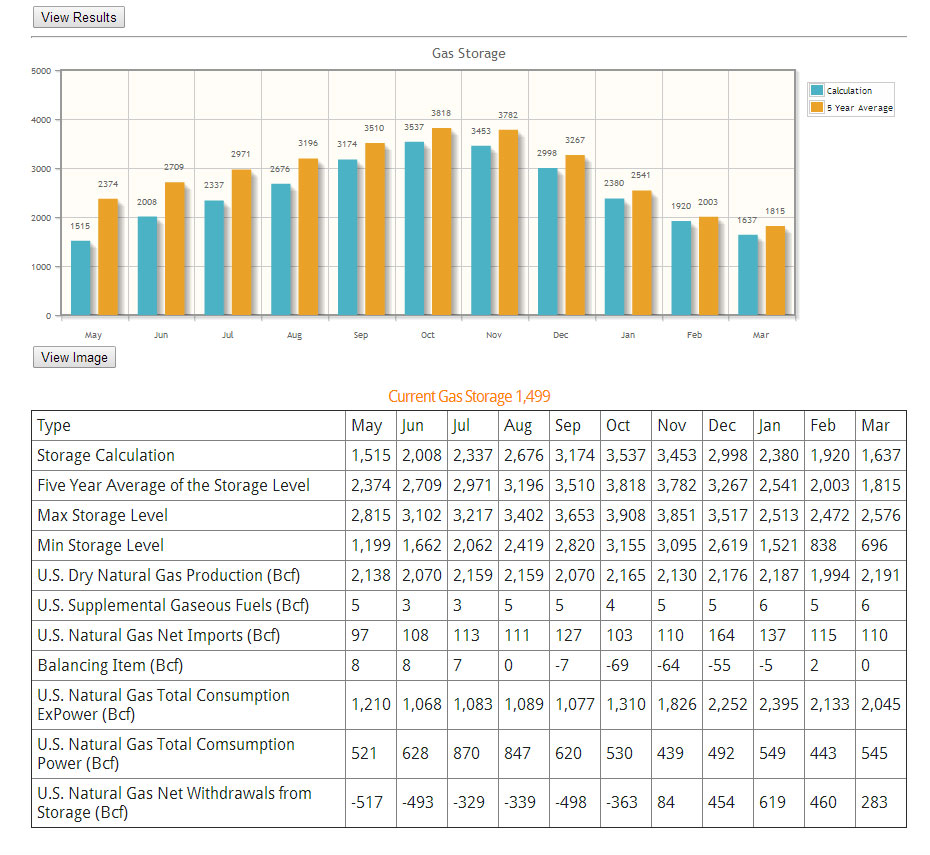
The results of the baseline is ending inventory in October around 3.5Tcf. This seems to be the market sentiment which puts the ending inventory 300 Bcf below the 5 year average. By the end of March the inventory is only 200 Bcf below the five year average. A screenshot of the result is below.
Baseline Storage Results
(Click Image to Enlarge)
The results of high case show with the price response of $5.5/MMbtu ending October inventory was able to end at 3.4Tcf ~400 Bcf below five year average. By end of March the difference between five year average widens slightly – see below.
High Demand Case Results
(Click Image to Enlarge)
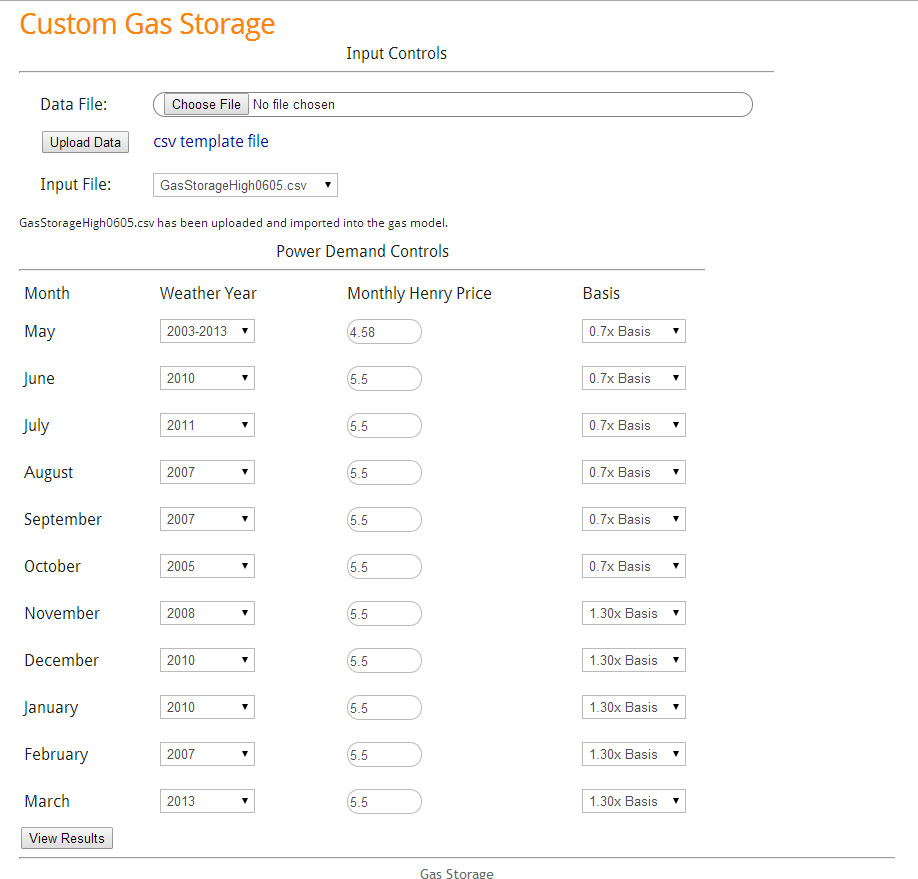
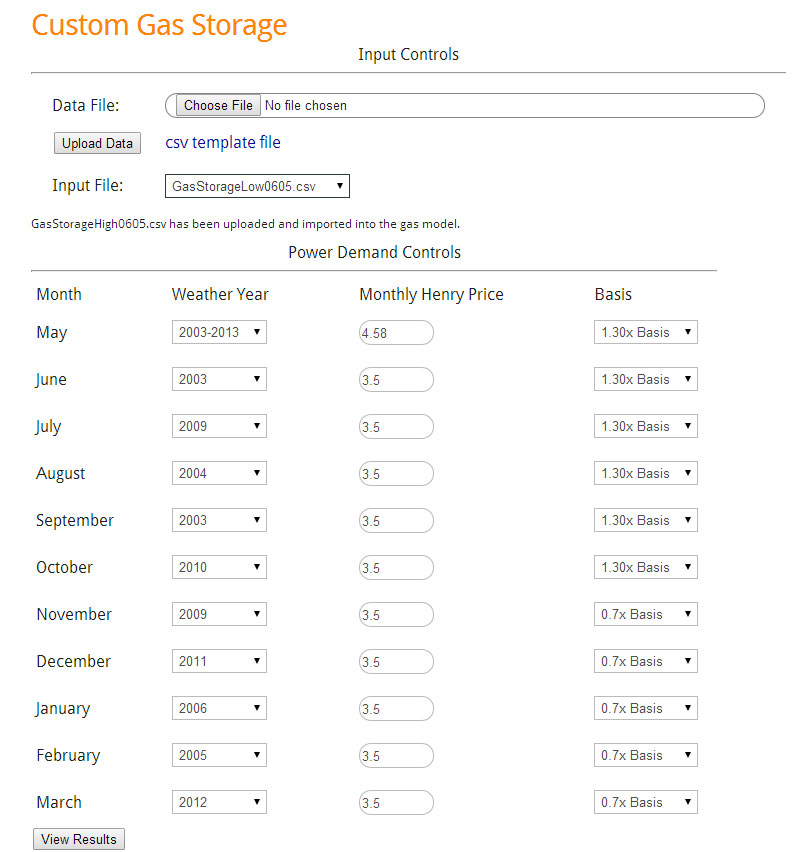
For the low extreme demand case, similar to the high extreme demand, only the demand components are adjusted. The change in demand outside the power sector from the baseline is narrow in the summer time. A weather analysis was performed to produce the drop in the winter time. This can be seen in the CSV file which was uploaded. For the power sector control, similar to the high demand, we chose the extreme low analog gas demand year. In addition we used a 1.3 factor for basis in summer and 0.7 factor in winter as indication of excess supply. Henry Hub was lowered to $3.5/MMbtu. The inputs are show below.
Low Case Inputs
(Click Image to Enlarge)
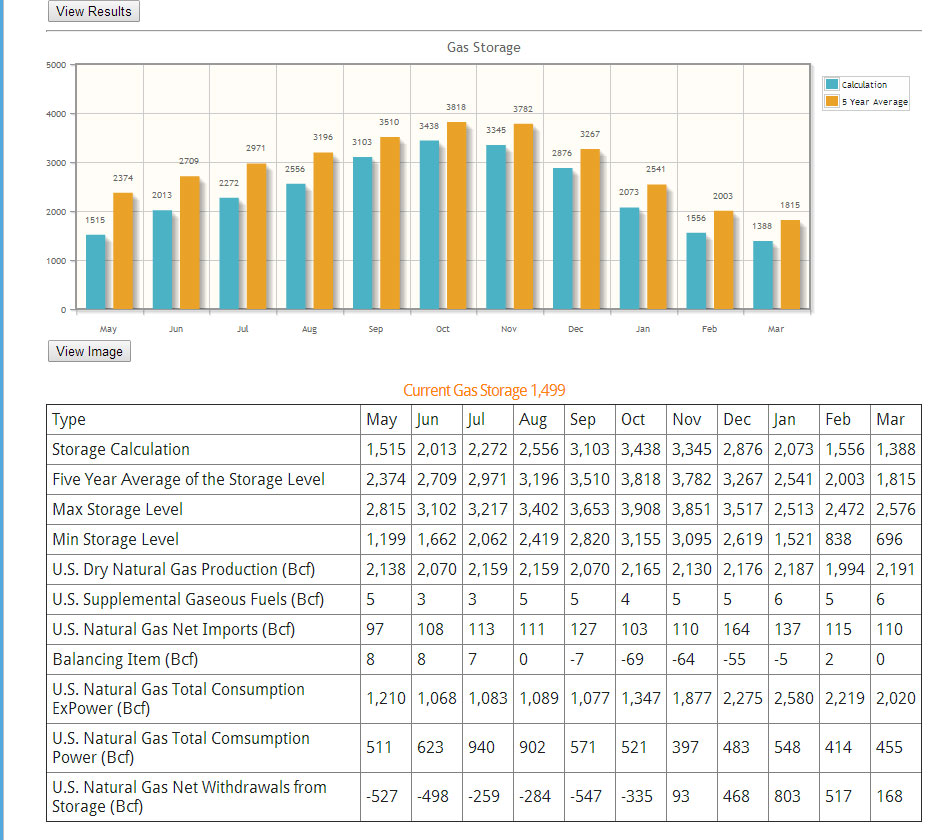
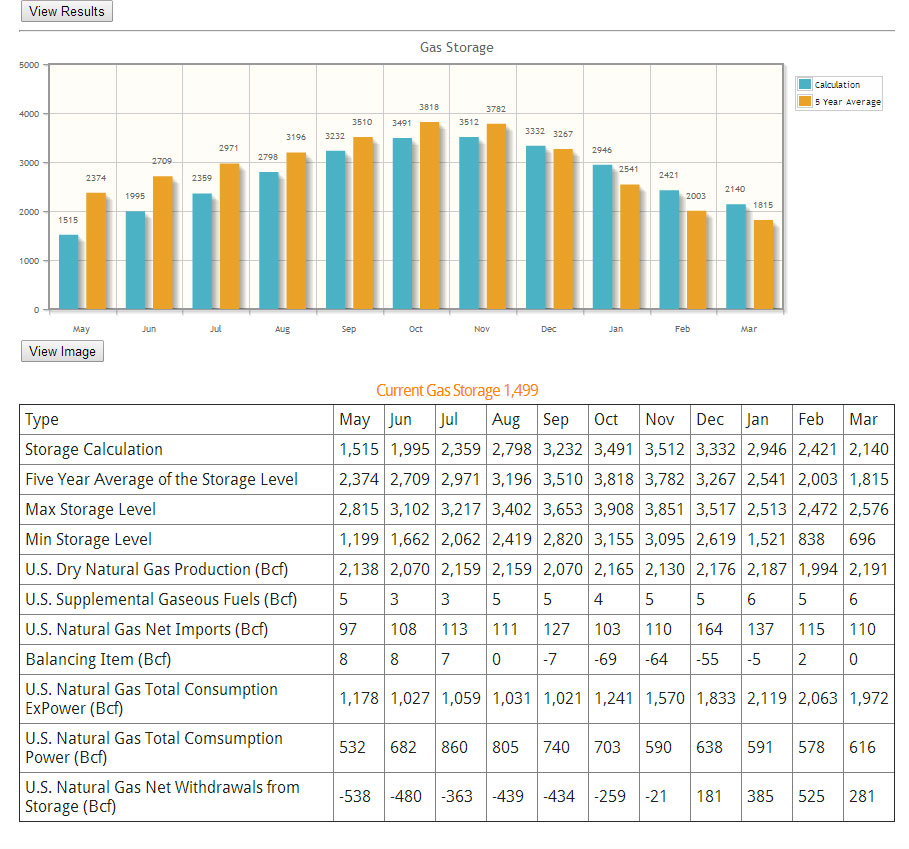
The result produces an ending inventory of 3.5 Tcf by the end of October, ~300Bcf below five year average. By the end of winter, the inventory levels surpass the five year average. In fact, there are months that actually set a new maximum inventory level. This likely indicates prices can potentially be lower than $3.50/MMbtu in those months. By the end of March, ending inventory is 2.1 Tcf which is 300 Bcf above five year average, but 400 Bcf below the five year maximum.
Low Case Results
(Click Image to Enlarge)
In conclusion, one can create a fundamental plausible scenario where gas prices go as high as $5.5 /MMbtu to as low as $3.5/MMbtu with changing weather as the key variable. Another study which can easily be done is creating a sensitivity on gas production. Given the current gas prices, we could see a surprise upside in gas production. At some point there is an equilibrium between production, price, and storage. With this tool one can easily investigate various scenarios to formulate greater knowledge in the gas market.
Hopefully I have demonstrated the power and ease of the tool to increase your knowledge.
Please contact me to schedule an online demo meeting[email protected] or 614-356-0484
We are focused not only on supplying answers, but empowering you to find answers.
Your Inspired Energy Consultant,
David
Founder & Principal
All Energy Consulting LLC
“Independent analysis and opinions without a bias.”
614-356-0484
[email protected]
blog: https://allenergyconsulting.com/blog/category/market-insights/

