Refining in the 21st Century Part 1 Cont’d
“He who can no longer pause to wonder and stand rapt in awe, is as good as dead; his eyes are closed.” Albert Einstein
I am sorry for those anxiously awaiting the continuation of Refining in the 21st century. I have been very busy for which I am very grateful for. I hope you have taken the time to reflect on what was discussed in the previous blog. A pause goes a long way in allowing us to process. Without further ado…..Part 1 cont’d.
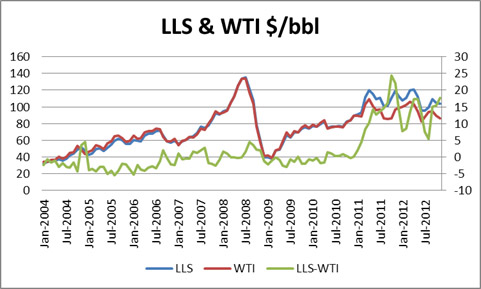
Now that the new paradigm has been set for oil, there are many inter-relationship that have changed. Of recent ,the EIA has shifted its reference fuel to Brent. This is a very reasonable shift as the center of demand is no longer the US but the growing Asia region. As an aside note, all the years I was at Purvin & Gertz, we never really believed WTI represented an appropriate benchmark for USGC. The better benchmark was LLS. However the financial market was too fixed to WTI to be able to change the benchmark. Currently you can see the reason why WTI can fail as a USGC benchmark. With the spread to LLS blowing up as pressure from Canada and shale oil have practically filled the center of the US; and with limited access to the USGC from Cushing WTI, it has decoupled to say the least against LLS – see chart below.
In the long run, this is one of the less costly economic arbitrages to solve via pipelines. In fact there is a pipeline reversal occurring this year along with an expansion. However the future markets continue to show a large spread with 2014 spread still above $5/bbl. A pipeline from Cushing to USGC should be able to produce reasonable economic return for $2/bbl with the past demonstrating much less.
Also many don’t understand a very important policy choice, that the Energy Policy and Conservation Act 1075 (P.L. 94-163, ECPA) which directs the President to restrict the export of crude oil. The US is in a very unique position given the shale revolution not only increased natural gas production, but also significant liquids production. This policy decision should lead to some strong US refining outlooks.
When we examine the refining world as I discussed previously, it is very highly dependent on the feedstock. There is so much to cover in understanding refining economics that I will write this section requiring some basic understanding of refining. Basics include crude oil quality and the difference between hydroskimming, cracker, and coker. Also an understanding of why refiners chose various crudes. I have spent days teaching the basics to clients who are brand new in the refining business. In fact one of my first international task was a course on refining to PDVSA. I have built some of the most sophisticated models for crude evaluations for both buying and selling. I believe the Kuwait Petroleum Company still uses the model we worked up for them at Purvin & Gertz. Nonetheless refining is not a simple discussion without some basic understanding.
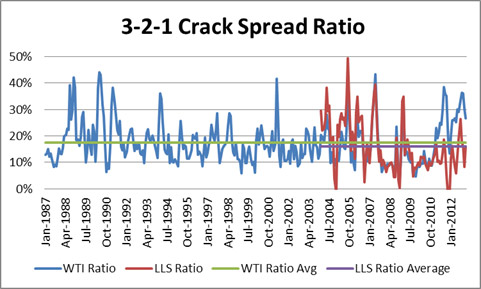
With the paradigm shift of higher prices allowed the spread of products to widen. It is only natural to think margins should move as percentages instead of absolutes. If your feedstock cost you $10 and your margin is $1 your return is 10%. If your feedstock is $20 and you still only obtained a dollar margin your return not drops down to 5%. This is likely going to hamper your ability to get financing and potentially put you out of business as your weighted average capital cost is above that unless you are regulated entity. This should be no different in the refining industry. The absolute value of the margin spread will be forever much larger than historical view until the feedstock falls back down. The proper view for refining margin is to view it as return on feedstock as seen below.
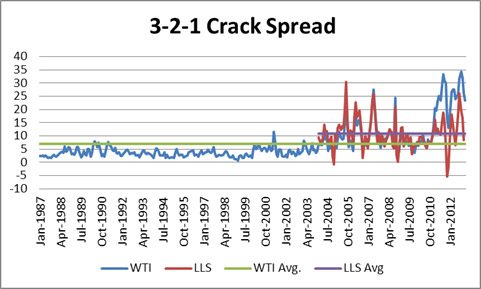
A return of 16-18% will likely suffice in the USGC to keep the industry going. WTI and LLS will converge to produce a return at that level. If we looked at it on an absolute basis – see below, it would suggest that refining margins will have much to fall in this $100/bbl environment, which is not the case.
The second most significant change in refining was the underlying belief in the increasing lower API and higher sulfur crudes – figure below. This made the refining strategy focus on technology and those that can process the more complex crudes would win over the simple refiners.
This came at a cost in both technology and variable cost. However the shale revolution has changed that paradigm. The liquids being discovered within the shale did not increase in API and also has lower sulfur. This caused those who embarked on the above strategy a mismatch. The light/heavy differential is not as wide enough for the increase cost these refiners now have compared to the simpler configurations. This will likely not alter the long-term requirement of the crack spread to produce 16-18% return on feedstock, but it will impact inter-refinery competition and the strategy used to manage a refinery. Once again my services would include helping you review your refinery and from crude selection to refinery optimization.
In Part 2 we will discuss where the markets will go from here. If you review what we have covered you will likely have a good idea already where the markets will go. Critical thinking is key in the forecasting business. I have had good fortune in my career to build that skill set. Please do consider All Energy Consulting for your energy consulting needs.
Your Very Grateful Energy Consultant,
614-356-0484
Refining in the 21st Century Part 1
“Life can only be understood backwards; but it must be lived forwards.” – Søren Kierkegaard
This is my thoughts on refining and where it is likely to go from here. Why would/should you care to listen to me? I had the fortune to work at the beginning of my career at Purvin & Gertz Inc. I had a great boss, Ken Miller, who unselfishly gave me his 30 years of experience in rather a short time period. My 15 minutes of fame was used up early in my career. I had the call of my lifetime when the oil markets collapsed in 1998.
Months ahead I was at my desk managing the firms World Supply/Demand balances. With my boss gone, a reporter, Beth Belton, from the USA Today called. I discussed my concerns at that time and was quoted that “It was very possible there will be a price collapse to $10/bbl.” As the cards turned out the market collapsed and in fact hit $8/bbl. At that level you might as well burn oil rather than refine it. This is important to understand if you want to understand refining. The value of petroleum products becomes very dependent on the price of the feedstock. If the feedstock becomes too low the products can only be valued so much. As the feedstock price rise, so will the ability of the product price rise. Many forecasters still fail to account for this simple concept. I still see many forecasts try to revert to old absolute value refining margins in face of this current $100/bbl environment. This is no longer your grandfathers’ market. We have moved into a new world in understanding the dynamics of petroleum market.
Part 1. How we got here
I plan not to cover the history of oil as presented so well in The Prize by Daniel Yergin, but to unearth the recent shift in oil price.
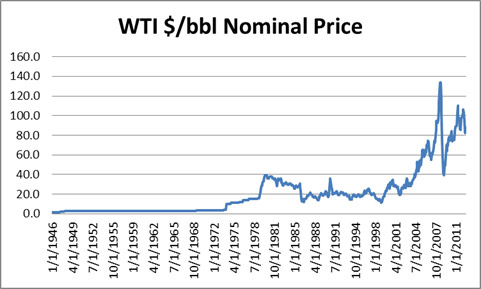
The sudden rise in crude oil prices in 2005 has been poorly explained in my estimates – see below. The crude oil markets are no different than any other commodity or goods other than its vast uses and requirements in modern day living. The rule of economics of supply/demand and price interaction applies. If we don’t understand the past we will likely not understand the future. There were two major forces to produce our current price regime. The most talked about is the enormous demand of the developing countries. However people stop there and make the assumption that the growth in those regions should explains the paradigm shift we see in prices. They don’t take the time to explain how exactly the growth in those areas could cause such a high price response.
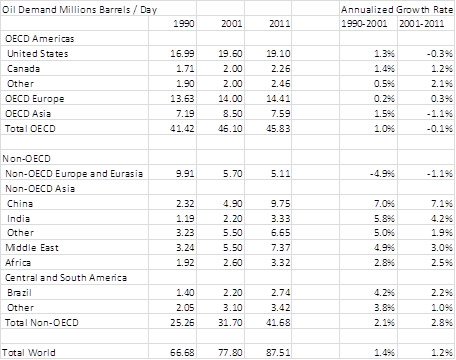
If we pause and take a look back at the spike in 1979, we see the market acted rationally. There was a supply shocked placed onto the market amounting around 4.5 million b/d. Annual prices moved up almost 3X in four years resulting in the first annual drop in world oil demand for three consecutive years (3% annum drop per year from 1979-1982). The market, then, entered into its new $20/bbl paradigm. The market had a few spikes with the Gulf War and other Middle East related issues, but overall the market was range bound. The growth from the 1980 to 1990 was around 0.7% per year. From 1990 to 2001 we saw demand rise by 2% per year – yet the price rise was relatively stable. Table below presents the change in demand in key areas.
Combined this with the price chart you get a fascinating picture. Within 4 years from 2001 to 2005, prices had more than doubled and by 2007 prices had moved up larger than the spike from 1977 to 1980. If you recall the previous rise resulted in 3 years of decline in demand, in this case nothing of the sort happened. World oil demand continued to grow. The reason for this is obvious if you examined the regions of strong growth. China, India, and the Middle East represent over 80% of the demand increase from 2001 to 2011. Each of these areas heavily subsidized the price of petroleum products for their citizens. To remove any regional issues you can look at Mexico in the Other OECD category. Mexico continued their demand growth in face of significantly higher prices while both US and Canadian growth declined. Mexico was able to do this because of the subsidies supplied by the Mexican government to its citizen.
The cure for high prices is high prices, but when the majority of the growth of oil demand does not see high prices; this causes an exponential price response. The demand response was shifted to the baseload demand in other regions. This is how the demand growth of the other regions impacted our price so significantly. It really is a trade issue. However for some reason this has escaped most of the pundits and the government officials. For the regions which exports oil, this was their bonanza. They got the rest of the world in essence to pay for their internal subsidies. Countries like China and India, they made a bet that the cost of the subsidy represented enough value for maintaining growth and civil obedience.
The “free” market countries basically got taken for a ride. One could say those who are subsidizing pay for it, but the question is who is getting paid and who really pays. I believe without this discussion and issue being brought to the forefront, many pundits misforecasted their outlook. People expected an economic response to pull price back down, but it never came. By itself one would think prices this extreme (nearly 4X that of the previous price level) should start modifying behavior and planning. However, demand and subsidies by itself cannot rationalize the extreme new price regime. It is the second reason that people fail to even consider to be a part of this historic price rise – Monetary Policy.
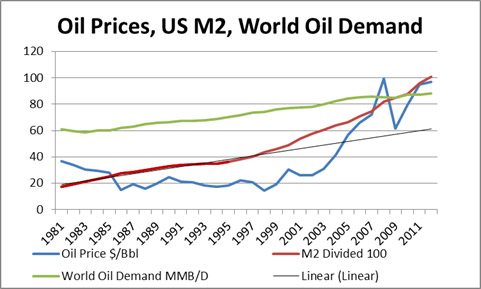
The chart above clearly shows the rise in US money supply began a new path in 1998 and accelerated in 2001. This was all done under the Greenspan’s thinking that we could avoid a recession through monetary policy, known as the Greenspan Put. It started in late 1998 while Greenspan initiated his first experiment by lowering rates to help recapitalize Long-Term Capital Management L.P. (LTCM). Many have deemed this a success in the early 2000’s and for that Greenspan, Robert Rubin and Larry Summers graced the cover of Time magazine.
However no good deed goes unpunished. As I have noted several times on my blog, spending what you don’t have, always will feel good in the moment. If you can spend without a credit limit you would probably be happy for the next 30 days before the bill comes. In the case of government spending, they never were forced to pay the bill – yet. The US is riding a credit card bill that has a perpetual moving due date with low interest. When you increase debt you are in essence borrowing from the future growth. In fact when you think about it, monetary policy is subsidization but in a more obfuscated form. Society does not really see the true cost until much later. Is there any difference to that and ignoring climate change? (for a future discussion).
The new trajectory in essence has further discounted the value of the currency as compared to the expected value. At some level the market begins to realize this issue as excess money cause asset values to rise, such as commodities. As a consequence many have suggested to blame traders for the run up in prices, partially true but more symptomatic as excess money usually tries to find a home. I ran multiple regressions from demand to population but no variable by itself produces a better correlation than money supply to the price of oil. If we take the former trajectory of money supply and compare it where we are now, the monetary impact would be 40%. This would in effect suggest without monetary impact the price of oil would be more in the range of $60/bbl vs. $100/bbl. This price still represents a strong price rise of over 2X from 2001 prices. Remember the 1979 issue saw a price rise of 2.6, but in seven years the new price regime settled at 2X. The combination of demand growth with subsidies for the growing regions along with monetary policy has given us our current landscape and both of these factors allows us to understand our current situation with our past.
Part 1 will be continued as we talk about the refining side of the picture and then move on to Part 2 where I plan to cover where we are going. I look forward to your comments and feedback. Please do consider All Energy Consulting for your energy consulting needs. I offer a unique blend of Oil, Gas, Coal, Power, and Renewable Experience. I have been blessed to have a very dynamic career, allowing me to continually grow which is perfectly situated to help your company not to be static in this ever changing world. I can offer my own forecast, or better yet, help you develop one, including many scenarios.
Your Energy Consultant,
614-356-0484
“How you gather, manage, and use information will determine whether you win or lose.” Bill Gates

