2014-2015 Winter Natural Gas Demand Expectations

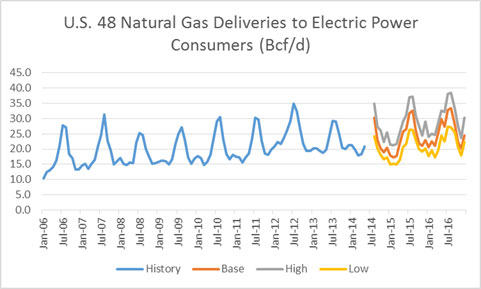
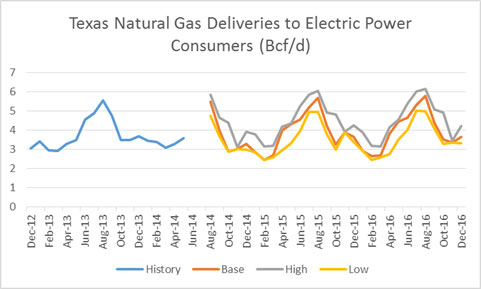
Given the current forward markets and expected shift in generation resources this winter, natural gas demand in the power sector will likely come back down from the highs generated last year given 10 year average winter. However in our high gas demand case where weather is colder than normal and gas-coal spreads move in by 50 cents we can see record winter power gas consumption of 22.5 bcf/d (Dec-Mar) – see figure below.
Figure from Downloadable Excel File for Subscribers of Power Market Analysis (PMA)
The new revolutionary product by All Energy Consulting’s (AEC), Power Market Analysis (PMA), is also designed to help those better understand the natural gas demand picture (Click for example of Power Trading and Hedging). Natural gas delivered to the ultimate end customer is made out of the following categories: Residential, Commercial, Industrial, Vehicles, and Power. The figure below displays the breakout by category by volume over time.
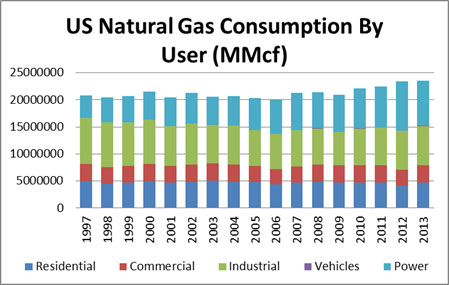
In a short time, gas usage has changed quite drastically with Power now being the largest demand portion for natural gas – see figure below.
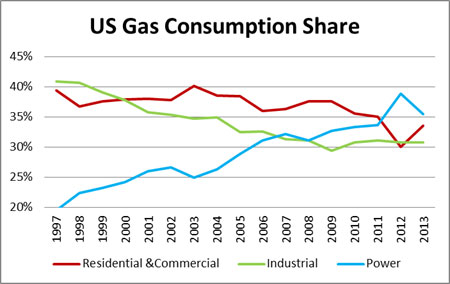
Unlike residential & commercial markets, the ability to forecast industrial and power gas demands go beyond the simple understanding of weather and the economy. The industrial picture is a data mining process of keeping track of plant closing and starts. The power demand is much more complex as there are significant inter-dependencies in the power market space. Gas demand in power is not just about price if that was the case demand would not have gone up over 4% a year from 2002 to 2008 while gas prices rose 15% a year. The reason for this rise had to do with required balancing of the market and the past market decisions – more discussed in our long-term gas outlook. The power market has a policy fundamental piece which causes certain technology to be retired (e.g. coal) and others to be built (e.g. renewable). In addition, the competing fuel price can cause significant demand swings (coal-gas switching).
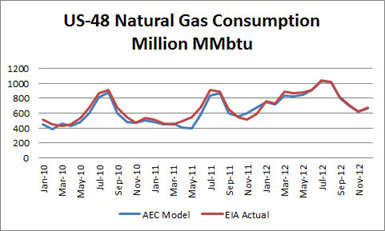
PMA is going to take the guess-work out for you in understanding the potential gas demand in the power sector. Our model is based on 20+ years of industry experience and took thousands of man-hours and hundreds of runs to develop and perfect. The underlying dispatch model used in PMA is AuroraXMP by EPIS. We can help those looking to implement AuroraXMP. The following results are historical runs with the actual loads and actual natural gas and coal prices depicted in the model. All other nuances, from outage and bidding logic, are the same as presented in the current PMA forecast models. The deviation from 2010-2012 averaged less than 4%.
Gas Consumption Power Sector Validation:
PMA will produce 5 cases of 2 year monthly projections incorporating all the risk in gas demand in the power sector from weather, economy, policy, and inter-fuel dynamics (coal-gas switching). Our model will run daily, incorporating the latest viewpoints from the forward gas and coal markets. The base model will also use AEC’s proprietary load forecasting model to project normal weather conditions. There are two gas sensitivities that will be generated along with the base case – high gas and low gas demand cases. The high gas demand uses historical weather on a monthly basis that drives the highest gas demand, plus it reduces the Henry Hub forwards will by 50 cents per MMbtu. The low case is the inverse of the high case with Henry hub forward adding 50 cents. These three cases will give you a good perspective on the high and low expectations of natural gas demand in the power sector. In addition, these cases can be customized to present even a broader range by incorporating nuclear outages to hydro capabilities.
PMA’s output is daily. Online visual displays are available. In addition, the gas consumptions are presented by month by state in an excel file which is in similar design to that published by the EIA. This format can be feed into leading natural gas analytical models such as GCPM by RBAC.
Texas Natural Gas Demand for Electric Power Excel Based View
Please email me at [email protected] or call me (614-356-0484) if you’re interested in learning more about our new PMA service or would like to discuss a consulting project. Interested parties will receive a free sample output file along with documentation supporting the validation of our modeling efforts.
Your Energy Consultant,
David
David K. Bellman
All Energy Consulting LLC- “Independent analysis and opinions without a bias.”
614-356-0484
[email protected]
@AECDKB
blog: https://allenergyconsulting.com/blog/category/market-insights/
Excellent Returns Were Produced From PMA’s Summer Model Predictions

As noted in our previous article – Effective Power Hedging, Power Market Analysis (PMA) can also be used for strictly hedging purposes. However the roots of PMA are for power trading. In this article we will examine PMA power trading results for the summer of 2014. We will demonstrate that our model and our advance trade screener have produced numerous winning trades over the course of the summer, generating significant returns with minimal risk.
As illustrated in our previous article, the non-customized PMA trade screener produced a winning portfolio of trades yielding over 10% returns in a month. This portfolio of trade opportunities was developed with no additional tools and insights other than our model calculations. All Energy Consulting believes incorporating PMA with other tools such as weather forecast (e.g., temperatures, rainfall, etc.) and market data feeds (e.g., outages, transmission constraints, etc.) will lead to even greater returns. We believe incorporating that knowledge in our previous example would have likely led to redistribution in the PMA portfolio, producing returns in excess of 20% vs. the 10% demonstrated.
PMA does not forecast weather. However it does run a range of simulations which can be used to predict the various outcomes of the future given changes in weather, gas prices, outages, and more. These sensitivities can easily be customized for your efforts. Using the default changes setup by All Energy Consulting, the model can identify fundamentally-flawed future market expectations, given the likely realities displayed in various future outcomes the model generates. These are the minimal risk trade opportunities identified by the trade screener. The trade screener scans through the various permutations and identifies these minimal risk trade opportunities, allowing one to quickly find a trade to execute.
In this article, we will not only review trades on a physical basis (as presented in the last article), but we also demonstrate the trade screener and how it can be used as a power tool within a financial trading effort to great success. In order to demonstrate the financial trading value of PMA, we will examine our predictions two months out, which was developed by PMA. As in our previous article, our starting date is May 20th 2014. We’ve screened for the trades in July On-Peak. Two value creating trades (both sell recommendations) were identified by PMA, – ERCOT North and Palo Verde – displayed in the screen shot below.

Executing both these of these trades would have yielded an average return of 22%. The results are presented below. In this case, a financial trade to sell ERCOT North and Palo Verde July contract is made on May 20th and then bought back a month later on June 20th.

If the trades were taken to the physical market an average gain of 68% could have been made.

For June 20th 2014 the trade screener found no minimal risk trades two months out. Note: In trading, sometimes it’s best to hold on to what you have.

Our July 21st 2014 screening did produce a set of winning physical trades for August — yielding 13% with three trades. For the two months out trade (September) – PMA showed its first buy signal in a while – NI-Hub On-Peak. On a financial basis that trade was only slightly up as seen below.

As noted previously, the above examples were produced using PMA only, absent of any additional tools such as (weather, market changes, etc.). As also mentioned earlier, integration of additional tools can be incorporated to produce even better portfolio results. All Energy Consulting is willing to team up with trading firms to advise and customize runs and screens to produce a winning power trading book with no upfront cost. This commitment should illustrate our confidence in the value created using PMA. AEC will consider taking a percentage of the profits as our only compensation. Please call or email for more information on this limited opportunity.
All historical runs and reports are online. The above can be easily recreated when you subscribe. We do not hide from our past results. Never be out of touch with the market. PMA is updated daily. Get a 30 day trial for only $1000.
Your Energy Consultant,
David
David K. Bellman
Founder & Principal
All Energy Consulting LLC
“Independent analysis and opinions without a bias.”
614-356-0484
[email protected]
blog: https://allenergyconsulting.com/blog/category/market-insights/
5 bcf/d Drop in Gas Demand from Power Sector in August Due to Weather

10 year average weather for August would produce gas demand near 30 bcf/d for the electric power sector. However, given the weather, gas demand is closer to our Power Market Analsyis (PMA) low gas demand case around 25 bcf/d. This is having a significant impact on storage causing weakness in gas prices. The storage levels are tracking closer to our low gas demand case as described in our previous article on extreme weather. This case had gas prices falling to $3.5/mmbtu. The models would indicate there is a greater chance for $3.5/mmbtu gas than $4.5/mmbtu gas assuming an ending inventory target in October of 3.4-3.5 tcf.
PMA now offers state by state gas demand in the format supplied by the EIA. One can use the data to feed into your gas pipeline model to calculate basis – such as the Gas Pipeline Competition Model (GCPM) by RBAC. A free sample file is available for download. This file is routinely produced and can be customized to your own sensitivities. Below are two graphs which can be generated from the file.

We will be coming out with a winter outlook report in the coming weeks. Please consider signing up to PMA to get the winter outlook. We have a 30 day trial for only $1000 which will give you full access.
Your Energy Consultant,
David
David K. Bellman
Founder & Principal
All Energy Consulting LLC
“Independent analysis and opinions without a bias.”
614-356-0484
[email protected]
blog: https://allenergyconsulting.com/blog/category/market-insights/
Effective Power Hedging – Demonstrated Using PMA
Whether you are a buyer, or seller, of power, an effective hedging program will save you from a ton of headaches, and questions. Power markets are the most volatile commodity given their dependence on various other commodities, the instantaneous nature of power, and the very limited ability for power to be stored in significant volumes. The primary purpose of hedging is to create a more predictable set of cash flow in order to run your business more effectively. An effective hedging program doesn’t leave significant money on the table, nor does it make significant money. If you really think you can make money from hedging, than you are trading, not hedging. Trading can be an effective business proposition, but it requires a lot more than hedging in terms of governance, infrastructure, and analytics.
Hedging can be relatively simple given that the goal is to assure more predictable cash flows, and not to make money. In hedging, the governance requirements are about monitoring and making sure a methodology is employed which has demonstrated the ability to be an accurate predictor in the past. Any significant variations in the past analysis should be flagged and addressed in the analytics. The infrastructure for hedging can be quite simple by employing a product such as Power Market Analysis (PMA) from All Energy Consulting. PMA can be used to create the timing signals and levels at which to purchase, or sell, power.
The analytics piece is the beginning, and the end, of developing an effective hedging program. The purpose of analytics is to develop an effective system to signal purchases, or sales, and execution volumes over time. The system should not try to guess, or time, the optimum purchase time, but scale into the hedge volume based upon signals. Initially it will take several iterations of back casting to the past to produce an effective methodology to achieve intended goals while meeting an organization’s stated requirements (risk tolerance, budget, etc.).
A simple mathematical approach of developing a hedge typically doesn’t take into account weather-based fundamental market movements and the resulting commodity price changes. PMA increases the robustness of any hedge process by producing a unique set of outcomes that show the risk and reward potential of locking in prices ahead of time. A simple concept of integrating PMA is to execute a hedge when the risk and reward profiles are asymmetrical. PMA, in its non-customized form, runs a relatively high power, and a low power price, scenario for all power markets in North America. The PMA model output provides the low, and high, expectations of power prices in the future. The model does not predict commodity prices, but uses forward markets for the implied forecast of the future. Given that you use the forwards markets to execute your hedges, it is only appropriate to use the commodity prices from these same markets.
In the table below, we present actual results published May 8th 2014. The results are due to the gas and coal forwards of May 7th. The table shows that the forward curve on May 7th for NEPOOL On-Peak trading is above $60/MWh for most of the summer months. The PMA model runs indicate a much lower price outlook, with only July and September possibly being higher (in the high power price case) as compared to the forward curve. Even if July were to achieve the high case, an increase of $6.89/MWh is being risked for a potential drop of $13.08/MWh. This is an asymmetrical risk-reward profile which should signal some volume of hedging, if one was a seller of power (owner of a generation asset). If one was a consumer of power, this would indicate to limit the hedge volume. In the end, this summer has been extremely mild. Buyers of the forward curve have had an agonizing summer, losing nearly $20/MWh for the summer. Sellers are somewhat relieved. PMA does not predict weather, but the low and high cases do represent extreme weather events impact on price levels. The model does not predict that it was going to be a mild summer, but it does show the forward curve has a significant premium relative to the potential outcomes. In this simple example, the May 8th report indicated a signal to lock in some of the power for the summer if you were a plant owner. If you were a power consumer, it signals to minimize, or not purchase, summer power as the exposure to higher prices is limited.

The signal is only one part of a complete hedging program. In order to design a comprehensive hedging program, you need to incorporate your specific situation in terms of expected shape of energy requirements, volatility tolerance, and budget. With this knowledge, one can then incorporate a volume of purchase, or sales, with the signal. All Energy Consulting can help you create an effective hedging program that minimizes your earnings volatility and reduces risk by employing an unemotional, analytical rigorous process based upon PMA.
Please do consider All Energy Consulting to help you design a headache free – no regrets hedging program, whether you are a buyer, or seller of power.
Your Energy Consultant,
David
David K. Bellman ([email protected]) 614-356-0484
Calculating the Benefits of EPA Clean Power Plan

If you thought the previous discussions of Clean Power Plan (Paper #1, Paper #2, Paper #3, Paper#4) were complicated, you have seen nothing yet. The benefit discussion of the Clean Power Plan moves into the world of art versus science. This section requires one to delve into philosophy and at the same time, process math. My one semester of philosophy in college perhaps may not cut it, but I will try my best. The most complete discussion of the benefits of the Clean Power Plan is found in the Regulatory Impact Analysis for the Proposed Carbon Pollution Guidelines for Existing Power Plants and Emission Standards for Modified and Reconstructed Power Plants. The title for the report foreshadows the complexity of the subject.
There are two major categories of benefits that are quantified by the EPA – Global Climate Change Benefits and the Air Pollution Health Co-Benefits. For the Global Climate Change calculation, they refer to another long titled report Technical Support Document: – Technical Update of the Social Cost of Carbon for Regulatory Impact Analysis – Under Executive Order 12866. In this report they are running models that have the supposed capability to model carbon dioxide dispersion and global temperature responses which lead to sea elevation changes and agriculture impact. This is certainly a grand model. Once again, the validity of these models are questionable given the lack of documentation of backcasting actual historical years. However, some credit can be given to these models given that they seem well thought out. They even include human adaption profile as climate change occurs. They note adaption is likely, but limited, therefore they mitigate some of the damages being computed due to adaptation. All the calculations were focused on damages and avoided the value of life calculations. The biggest outcome of the report was the following statement: “…climate change presents a problem that the United States alone cannot solve. Even if the United States were to reduce its greenhouse gas emissions to zero, that step would be far from enough to avoid substantial climate change.” Therefore to give a value of benefit of CO2 reduction could be all for nothing unless the world is collaborating. This makes EPA’s claim of the $30 Billion dollars of climate benefit in 2030 very questionable given the lack of global participation to mitigate CO2 emissions in the world.
The Air Pollution Health Co-Benefits, unlike the Global Climate Change, is very dependent on the value of life. As noted in their footnote on many of the benefit tables – “The air pollution health co-benefits reflect reduced exposure to PM2.5 and ozone associated with emission reductions of directly emitted PM2.5, SO2 and NOX. The range reflects the use of concentration-response functions from different epidemiology studies. The reduction in premature fatalities each year accounts for over 90 percent of total monetized co-benefits from PM2.5 and ozone.” This is a very interesting footnote, as this was also noted for the Mercury Air Toxics Standards (MATS). “The reduction in premature fatalities each year accounts for over 90% of total monetized benefits….The great majority of the estimates are attributable to co-benefits from 4,200 to 11,000 fewer PM2.5-related premature mortalities”. Section 4.3.2 in the RIA details the calculation for the Clean Power Plan. EPA notes “Avoided premature deaths account for 98 percent of monetized PM-related co-benefits and over 90 percent of monetized ozone-related co-benefits.” Therefore out of the $25-59 Billion identified in net benefits 90+% comes from premature deaths. EPA noted they used the value of statistical life (VSL) at $10 million in 2030. At $10 Million dollars a life, the reduction of premature mortality amounts to 2,500 to 5,900 less than 0.1% of babies born a year in the US. I have no expertise to argue the merits of this, but I can put this into perspective. Based on the EPA logic, as a society it may be cost effective to require swimming lessons. According to the CDC, 3,533 fatal unintentional drowning occurs per year outside boating related incidents. Using EPA calculation method, this amounts to 35 Billion dollars a year of benefit if drowning could be prevented. If everyone in the US took a group swimming lesson (7 classes) for $66 this could produce a net benefit of 7 Billion assuming ¾ of the deaths could be prevented by attending swimming classes. Consider another perspective. As a society, we should probably invest a lot more in mammograms and screening tools given 10,000 women die a year because of ineffective screening tools. If this could be prevented, a benefit of $100 Billion would occur using EPA calculation. With $100 billion on the benefit side of the equation, many programs and additional screening could be done and still produce a net benefit. Here is one final perspective on the logic employed by EPA for justifying the cost having to do with prohibition. Using this analysis, one could quantify the benefits for banning alcohol based on mitigating alcohol abuse deaths. According to the CDC, 88,000 Americans die each year due to alcohol abuse. Using EPA benefit analysis, almost a trillion dollars would be placed on the benefit side of the equation for prohibition. Does the cost of prohibition add up to a trillion dollars?
If we remove the life portion of benefit, this leaves the Air Pollution Co-benefits of between $2.5 – 5.9 Billion. They did note other benefits they did not quantify, such as health reduction from direct exposure to mercury, SO2, NO2, and CO. In addition, there is value for visibility improvement not added into their benefits. They do not talk about the positive externalities that occur because of low cost power which could be eliminated with this program. This is a point missing in general academia. There are externalities that are also positive as I noted in my previous article.
In conclusion, many of the benefits are questionable, since they depend on global participation, or they are valuing benefits on a value of life calculation which needs to be measured accordingly with other worthwhile life savings initiatives. As noted in my previous article on cost, it would seem the cost is underestimated, and the benefits could be overestimated. The benefits are much more subjective and require a level of knowledge few may have obtained – including myself. Understanding and valuing life plus quantifying a range of externalities certainly require more art than science. Cost, on the other hand, is much more science than art. This subject certainly stretched my comfort zone, but this analysis shows the importance of reviewing the numbers behind the numbers and the value of taking philosophy classes.
Your Ever Willing to Learn More Energy Consultant,
David
David K. Bellman
Founder & Principal
All Energy Consulting LLC
“Independent analysis and opinions without a bias.”
614-356-0484
[email protected]
blog: https://allenergyconsulting.com/blog/category/market-insights/
Adding insights to PMA
Power Market Analysis (PMA) is now even more insightful with the addition of two more additional runs to the base case. PMA understands the future holds much uncertainty. The value of PMA is to understand that uncertainty. PMA is a tool to help those in the Gas and Power markets. Already PMA tries to formulate the maximum and minimum power price across the country. The power cases allow for one to compute the risk of a trade decision, plus using these cases can also help identify winning trades as previously discussed. Even if you are not trading, but in a role to make decisions on energy procurement, PMA can help you understand your decisions. Adding our expertise with PMA, we can help end-users develop a comprehensive hedging strategy.
Now PMA is producing a maximum and minimum gas demand case. Using the 10 year weather analysis done previously, a constructed maximum and minimum gas demand was developed. In addition, the forward curve is adjusted downward by 50 cents for the high gas demand case and upward by 50 cents for the low gas demand case. These cases will help those trying to understand the gas markets. They can be used to help give you a good sense of when the market is at the bottom or top in terms of power demand.

In summary, PMA has added two new scenarios within their daily produced runs. All 5 scenarios are now part of the trade screener, thereby giving more certainty for the recommend trades being produced by PMA. Don’t be caught off guard by potential changes in the market, sign up now for PMA.
Please call or email to schedule an online demo of the latest most advance way to analyze the power markets – [email protected] – 614-356-0484.
Your Ever Improving Energy Analyst,
David
David K. Bellman
Founder & Principal
All Energy Consulting LLC
“Independent analysis and opinions without a bias.”
614-356-0484
[email protected]
blog: https://allenergyconsulting.com/blog/category/market-insights/
