PMA for Gas Companies

Subscribers Logon: https://allenergyconsulting.com/Data/
Natural gas is one of the most volatile commodities in the U.S. — both at a macro level and within micro-markets. Understanding the drivers of this market can provide key insights for short-term operational decisions and longer-term contracting, pricing, hedging and planning decisions. Insights on regional demand will also help in understanding basis pricing.
Supply and Demand balance can shift rapidly. Natural gas storage acts as a buffer for physical deliveries, but price fluctuations can result in significant income variances.
Natural gas supply numbers are fairly easy to predict, however demand can swing wildly due to: (1) weather events; (2) fuel switching in the electric power industry. The solution is to develop accurate and reliable forecasts of natural gas demand.
Three major modeling methods must be used to forecast natural gas demand: (1) weather-related demand for natural gas for heating; (2) weather-related demand for electric power; (3) economics driving demand for natural gas within the U.S. power generation fleet. Number 1 is very consistent and will produce a high correlation using the historical weather data and actual demand. Number 2 requires further analysis as electricity markets are not tied together as natural gas demand. Number 3 requires further analysis plus new skill sets as electric markets are dependent on various commodities (e.g. gas, coal, nuclear, and oil) and regional polices (e.g. CO2, Renewable Mandates).
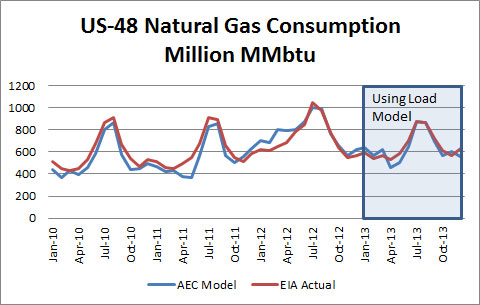
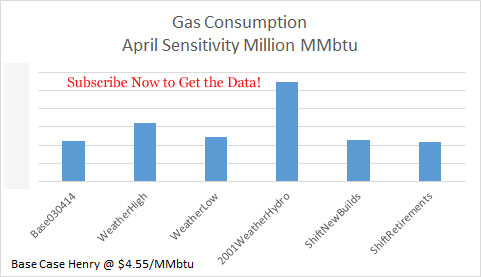
Power Market Analysis (PMA) is here to solve #2 and #3 modeling methods for you. Sophisticated understanding of electric power markets coupled with detailed modeling of power generation fleet. Years of testing have validated the accuracy of the model. Output in easy to access state by state demand MS Excel files. Files can be easily used with GCPM natural gas model by RBAC. Model is run daily with 5 sensitivities keeping you always up to date on the expected gas demand from the power sector.
Validation Graph:
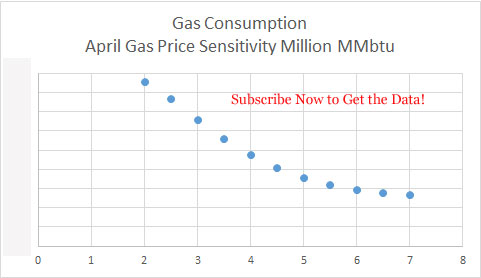
Sample Analysis:


