Assessing the Cost of EPA’s Clean Power Plan
In order to understand the following, one needs to have read the Clean Power Plan and/or read the 3 summaries I put together of the Clean Power Plan (Paper #1, Paper #2, Paper #3). Reading those three will allow you to get an understanding of the areas of cost that I plan to discuss below.
The Clean Power Plan notes the cost metrics in consumer terms: “Under Option 1, average nationwide retail electricity prices are projected to increase by roughly 6 to 7 percent in 2020 relative to the base case, and by roughly 3 percent in 2030 (contiguous U.S.). Average monthly electricity bills are anticipated to increase by roughly 3 percent in 2020, but decline by approximately 9 percent by 2030. This is a result of the increasing penetration of demand-side programs that more than offset increased prices to end users by their expected savings from reduced electricity use.”
In demonstrating the cost metrics in utility terms, they offer a significant amount of disclaimers “The compliance assumptions – and, therefore, the projected compliance costs – set forth in this analysis are illustrative in nature and do not represent the full suite of compliance flexibilities states may ultimately pursue. These illustrative compliance scenarios are designed to reflect, to the extent possible, the scope and the nature of the proposed guidelines. However, there is considerable uncertainty with regards to the precise measures that states will adopt to meet the proposed requirements, because there are considerable flexibilities afforded to the states in developing their state plans.”
The EPA estimated compliance cost states “The EPA projects that the annual incremental compliance cost of Option 1 is estimated to be between $5.5 and $7.5 billion in 2020 and between $7.3 and $8.8 billion (2011$) in 2030, including the costs associated with monitoring, reporting, and recordkeeping (MRR).” The key word in the statement is annual. These costs can be expected each year. The EPA noted this is based on the difference to their base case, but was not explicit in their base case assumptions.
There are significant moving blocks, and the ability to model all of these options take time. In order to speed up the process, I approach the problem focused on the existing fleet and current load projection for 2016. Using 2016 will essentially show the remaining fossil fleet that is likely going to be impacted by the Clean Power Plan. This part of the analysis is centered on BSER 1 & 2 (plant efficiency improvement & redispatching). The targeted CO2 values for each state existing fossil fleet were extracted from the EPA model assuming BSER 3 & 4 (Non-Carbon Generation and Demand Side Efficiency) will deliver as EPA projected. Out of all the blocks, BSER 1 & 2 are the most tied to the market place given their impact is on the existing fleet. The BSER 1 & 2 represents almost 40% of the total rate reduction.
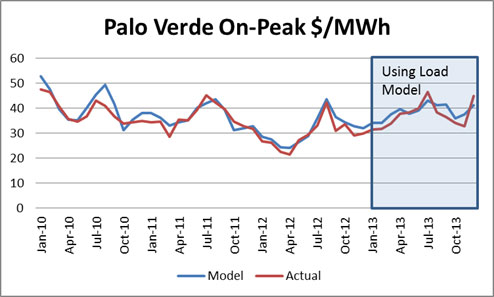
The models I am using are very sophisticated and robust. These models are used to make financial decisions in the current market place for both gas and power markets through the product line – of Power Market Analysis (PMA). The base dispatch model is the AuroraXMP model by EPIS. The entire N. America is being modeled. A significant amount of work was needed to produce a model that is applicable to today’s market.
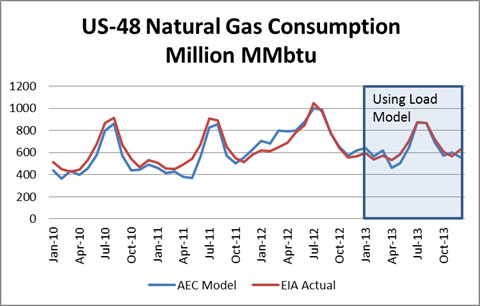
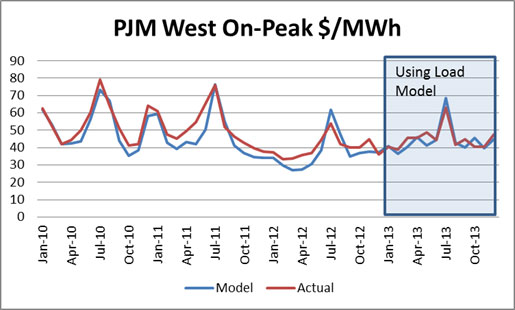
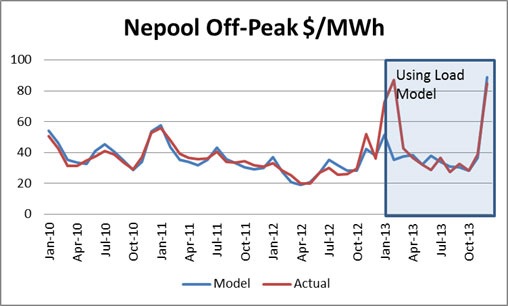
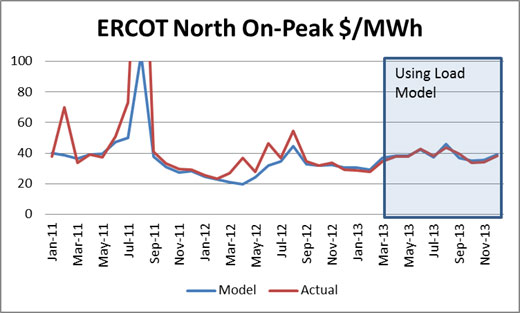
Validation of the model is continually being done. If your consultant is charging to see validations or has not done one in some time I would be skeptical on the results. Below are a few graphs validating my process – many more available per request:
These large models as used by the EPA – EPA used the Integrated Planning Model (IPM), developed by ICF International – I have always been interested in their ability to backcast the actuals on a monthly basis using their forecast methodology. Without first presenting and establishing the model tendency how do you know that the model can forecast? It may not be the model, but the data inputs the user is applying to model which could result in wrong output. Many large models typically make the excuse they are not interested in the daily or monthly changes, but want to show the “high” level impacts. I would be cautious on the ability to calculate economics in the market at that point.
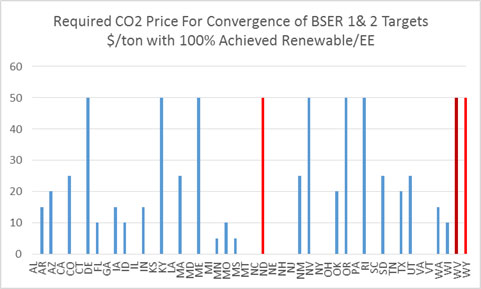
The simulations were all based on the forward curve prices published on June 5th 2014. After around 14 iterations I was able to reach an acceptable convergence to produce the state rates suggested by the EPA through re-dispatching with individual state CO2 price being the variable to target state rates. There were 3 states that could not converge to an acceptable level so I left them at the max of $50/ton. There are 21 states where the price of CO2 was essentially zero – see chart below. Significant renewable and DSM and the retirement of coal units in these states drove them to essentially not have to alter their dispatch to achieve the state targeted CO2 rate.
In addition to EPA “optimize” case, I ran a case with only 60% of the renewable and DSM/EE. This is reasonable case in the sense the EPA guideline for BSER 3 & 4 are based on non-empirical goals (State Renewable Program Goals and Other State Experiences). I discuss the concerns of this method in Paper #3. Nonetheless, I do believe more than half of the expectations can and will be achieved – hence I chose 60%. This obviously dropped the targeted rate with some as low as 60% of the initial targeted rate. In the 60% case there were 6 more states that hit the maximum $50/ton case. There were only 15 states with zero carbon cost – See Charts Below.
Note Illinois did not require any carbon cost in both cases. Ohio actually fared well because the utilities had to burn through many of their coal plants in 2012 even though it was uneconomical, and scheduled retirements in 2014-2016 help achieved the targeted rate. The big question for Ohio is can they achieve their renewable target. I have done a state by state report plus added a feature to be able to extract particular units within the state to inform you. A sample file for Colorado is available. If interested please send me your state(s) interest and the amount you are willing to pay for this highly informative report. Also add a note if you want a particular group of assets evaluated.
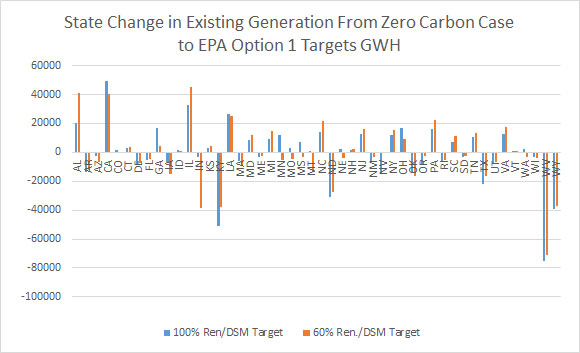
The runs did produce a list of winners and losers in terms of existing power plants. As an existing power plant you want to be in Illinois, Alabama, and California not Kentucky, Indiana, or West Virginia – See Chart Below
In theory, the quantification of just BSER 1&2 cost would be below the actual cost of the total Clean Power Plan. The other parts of the program involved new creation. In most cases, an existing already paid for resource cannot be economically challenged from new items including many DSM programs. The 2016 run already retires many of the uneconomical units. The below chart shows the impact of wholesale power prices as a result of “forcing” redispatching to achieve target.
Wholesale power prices increase 20% in the 100% BSER 3&4 case and in the 60% BSER 3 & 4 case almost 40%. The way power prices are set, the marginal unit sets the price for all units in a given hour. Therefore, even if you bid into the system at $5/MWh, if the marginal unit (the last MW to fill the required electric demand of the system) is $100/MWh, you will get $100/MWh. In a regulated framework, this is less important since the structure is built on cost and depending on if there are outside shareholder additional returns (8-15%). Given the EPA statement, “retail electricity prices are projected to increase by roughly 6 to 7 percent in 2020 relative to the base case” & “Projected wholesale electricity price increases over the same period were less than seven percent”, I am not sure they are appreciating the deregulation impact. The 7% does align with comparing my fuel cost from the increases seen in the various cases. However, I did not change the fuel prices even though EPA analysis did show this would likely happen – increase gas price and lower coal price. The cost world is generally gone in the generation space. Generators below the marginal power plant will keep all the gains vs. being satisfied with a cost basis. The box on de-regulation is open and not likely to come back.
Energy revenue for the entire system went up $130 Billion in 100% BSER 3 & 4 and $243 Billion in 60% BSER 3 & 4. There are still systems that are fully integrated therefore will not capitalize on the opportunity to charge more to the customer. There is no doubt the cost of the power price impact will be much greater than noted by EPA.
As pointed out several times, this is the piece involved in the existing fleet which is an integral part in achieving EPA Clean Power Plan CO2 rate targets.
There are several points made by the EPA alluding to cost being reduced due to energy efficiency – “Average monthly electricity bills are anticipated to increase by roughly 3 percent in 2020, but decline by approximately 9 percent by 2030. This is a result of the increasing penetration of demand-side programs that more than offset increased prices to end users by their expected savings from reduced electricity use.” This is true for some, but not all. The other half of the system (transmission & distribution) is still regulated. The programs are not free. They do cost money and must be paid for. The local distribution company can save when you are efficient in not causing large capacity payments and/or limiting inopportune times of buying power (high demand periods). This has been known for many years. As users become more efficient the regulated group still is promised the cost of operation. The only means of collecting the cost is charging users of electricity. As usage goes down, the cost collection goes down. Therefore, rates go up to compensate. The issue will become creating balance programs so that the wealthier who can afford the programs do not cause the rest of society to pay more. The regulated world is a zero sum game even more so without the generation piece.
It is easy to calculate the cost of the renewable piece. I have a state by state sheet showing the various targets set forth and calculating the cost using conservative estimates on the cost of wind and its performance. The renewable piece will be easily $200 Billion which comes out to be $11 billion a year. This makes this statement very confusing “The EPA projects that the annual incremental compliance cost of Option 1 is estimated to be between $5.5 and $7.5 billion in 2020 and between $7.3 and $8.8 billion (2011$) in 2030” Perhaps the rationale for difference is the base will already have that cost built in. However, with low gas prices and a lack of incentive, such as a carbon price, I don’t believe the renewable levels would be achieved to the extent the EPA is targeting. Even half the difference still shows the capital cost to be low. The DSM/EE programs do cost money. The higher power prices will cost the local distribution companies more and the generators who are left to compete are not going to send a bill that is cost plus.
Though the cost is higher than EPA projects, the benefits may still be there. In the next and final synopsis on the Clean Power Plan, we will review the benefits.
As noted previously, I have spent significant hours analyzing and modeling the Clean Power Plan Act with no payment from any source for this effort. The big driver in taking on this task is my personal intellectual interest. There is hope I can monetize some of my work. I do have the state by state report which I am hoping will be of interest – State of Colorado sample. Plus I can do a fleet analysis if you want to know how your assets will perform in this new world. I can also assist in developing a strategy to not only survive but to capitalize – where there is change there is opportunity.
Please do consider me for your energy consulting needs.
Your Inspired Energy Consultant,
David
David K. Bellman
Founder & Principal
All Energy Consulting LLC
“Independent analysis and opinions without a bias.”
614-356-0484
[email protected]
blog: http://allenergyconsulting.com/blog/category/market-insights/
Fact Check – Lifting Oil Export Ban to Create Lower Gasoline Prices – Likely True for Some Time
There is so much material to discuss recently as I try to finish my review of the EPA Clean Power Plan (Paper #1, Paper #2, Paper #3). This morning I saw the solar discussion and now I see this article with one of my former colleague and friend as co-author. The heading was very catchy – “Why the U.S. Needs to Lift the Ban on Oil Exports Surprisingly, this will mean lower gas prices at the pump, and a greater supply of crude in an unstable world.”
They did a great job pointing out the history and facts of the export ban. They also presented the major concern of the oil producers. “…so called tight oil, or “light oil” recovered by hydraulic fracturing and horizontal drilling—is a poor match for refineries in the Midwest and along the Gulf Coast. Refineries have spent more than $100 billion in recent decades reconfiguring their equipment to process heavy, lower-quality imported oil from Canada, Mexico and Venezuela, as well as the new supplies coming from the Gulf of Mexico. They have been able so far to absorb the new light crude but are reaching their limit even as tight production keeps growing. If these reconfigured refineries run more light instead of heavy crude oil, they lose output capacity—and revenue—due to a mismatch of the light oil with their equipment. To make up for the lost revenue, refineries won’t buy the light oil except at a discount, which could run as high as 20%. At that price, oil producers can’t cover the cost of some of the new wells, and cash flows would decline. This means less drilling and lower crude production.”
This same issue was pointed out in my US refining outlook for 2014 done back in February. I will respectfully disagree with the hidden conclusion that eliminating oil exports in the US will be the BEST decision. At the same time, I will agree with their conclusions that there is a possibility that gasoline prices can be reduced by as much as 12 cents a gallon by removing the restriction. The reason for this is not that 12 cents cannot happen but it may not answer the real question that should be posed which is this removal of the ban the best decision over time. The logic that world markets could get immediate relief and an optimized US refining industry would produce a more optimal solution for the world system is reasonable. However this conclusion does not state that it is the best for the US. It does show benefits in a discrete time period. There is a possibility those 12 cents savings disappears over time as demand grows in other markets.
Economics would lead you to rationalize making a finished product is worth more than the raw commodity that made up that product. The difference becomes the margin in applying work. This margin and the value for that creation can be kept in the US if the export ban was continued. There is a solution to the significant light oil discount beyond reconfiguring existing refineries, which made a business decision based on full knowledge of the restriction and the potential landscape shifts. Capital investments can be made in existing facilities, brownfield/refurbishment (I do know a 80,000 b/d condensate refinery that can be brought back to life for $800 million in 18 month time projected IRR 30+% – email me if you are interested), or build a new refinery. They did note the option of new refineries would take time. However, it is this time element which is needed to make business decisions that last decades. Continued certainty of discounts will add to decisions to build/refurbished/retrofit refiners in the US. This will create multiple jobs plus convert the US to potentially being a net exporter. Currently, the US is still net importing around 6 million barrels per day. The Latin America market is growing and it would be the ideal export area for finished products such as gasoline. Given the statement from the article “U.S. gasoline prices are set by global gasoline prices”, as a country you wouldn’t want to be the importer particularly in the scenario when other markets start valuing gasoline much higher. Being a net exporter, you are guaranteeing the local consumer a discount to world market prices per transportation netback calculation.
I will conclude with their statement and append it “Ending the ban would enable the U.S. to benefit significantly more from its oil-production renaissance” in the near-term, however if we could get our act together perhaps there is a chance to revitalize our trade imbalances and become a net exporter and serve the growing markets of L. America by keeping the ban.
By the way, I am a libertarian at heart and many know me to be. However I am a practical libertarian in that I understand a system with limited government intervention is the best, but the world is full of government intervention (e.g. huge oil subsidy to local consumers in the Middle East) therefore it would be foolish to blindly stay 100% with an ideology that the premise of the ideology cannot be created.
Your ever searching for the Truth Energy Consultant,
David
David K. Bellman
All Energy Consulting LLC- “Independent analysis and opinions without a bias.”
614-356-0484
[email protected]
@AECDKB
blog: http://allenergyconsulting.com/blog/category/market-insights/
Fact Check – Solar Land Space Needs
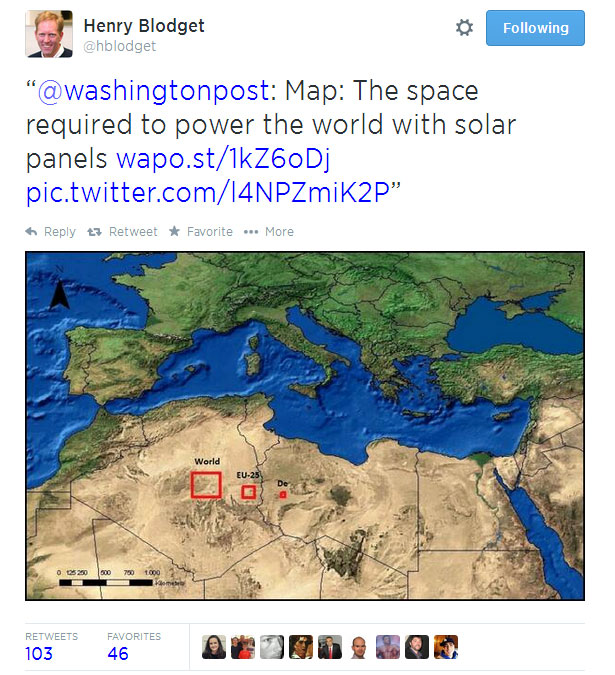
I am still working on reviewing the EPA Clean Power Plan analysis (Paper #1, Paper #2, Paper #3). I am currently running multiple dispatch simulations to produce an impact analysis using AuroraXMP. However, I got distracted from a twitter blog that showed the solar land requirements for the world to be extremely small. See blog screenshot below.
I traced the source to this paper from a student who wrote it for their Diploma Thesis. On page 11 & 12 of their report are the claim and the graphic being spread on the internet. The first issue which should jump out is the statement “If a solar electricity yield of 250 GWhel/km² is taken as base ….” Doing a little research one can conclude at best that yield is off by 3X per the latest by National Renewable Energy Laboratory (NREL). In addition, the world electric consumption seems to be a little low in the assumption used 16,076 TWh/y vs. 20,280 TWh/yr.
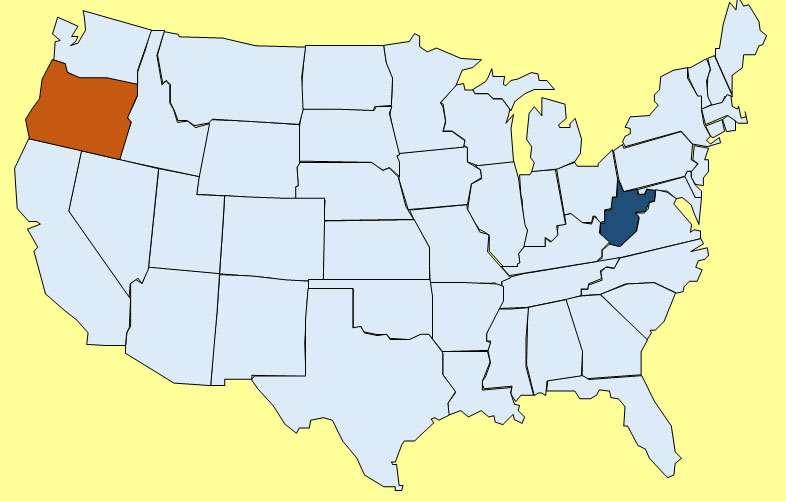
If we recompute the numbers using a low estimate of land use per NREL of 3 acre/GWH-yr, the state of Oregon becomes the world size requirement versus the analysis which was closer to the size of West Virginia. West Virginia is more represented of the US requirement. This is not including the need to get battery storage and transmission. Battery storage size would be much smaller – less than Rhode Island. However land requirement is only one piece of the puzzle. Data source for state area.
The initial capital cost of such endeavor would be at least twice as large as using natural gas generation. Utility scale solar cost is at best around $2000/kW – then a utility scale battery would add another $500/kW versus a brand new gas plant which is around $1000/kW. The gas plant does have a significant variable cost, but as many of you know who have to budget your money, the best decision for the long-run sometimes cost too much given your current capital constraints. The trend for de-regulation for the generation business puts a greater limit on the ability to make these longer term decisions.
Lesson learned always check your facts when it comes to energy related discussions. It is too easy to manipulate the facts, because there is so much data and few go deeper to find the truth. The truth shall set you free.
Back to EPA analysis – stay tune….
Your Energy Consultant in Search of the Truth,
David
David K. Bellman
All Energy Consulting LLC- “Independent analysis and opinions without a bias.”
614-356-0484
[email protected]
@AECDKB
blog: http://allenergyconsulting.com/blog/category/market-insights/
#3 Clean Power Plan Assessment
Let me note a couple points of reflections from my last review of the Clean Power Plan before I proceed with the next portion of the plan. The choices made by human civilization over time typically revolved around resources. Certain groups became experts at their region and learned how to extract and use their resources (e.g. Coastline habitats typically became expert fisherman and trades people). The US unlike many other nations is a large conglomerate of vast and different regions. For the most part, the US respected the states’ rights, and each state grew to maximize their resources without much force to do it one cerain way. Renewable generation is not a universal accessible. There are regions that clearly will have better performance in certain renewable generation (e.g. Solar – Arizona, Wind – West Texas, etc…). The EPA tried to balance that by using the state RPS programs. However, the state RPS programs became a political tool rather rooted in economics and science. To substantiate that point, many RPS programs offer an escape clause (e.g. Alternative Compliance Payment) so the politicians can take credit for promoting without having necessarily to commit. This made it much easier for some to pick catch phrase policy such as 20 by 20 (20% renewable by 2020).
To have solar mandates greater than states such as Arizona, in the end, offers a huge subsidy to those states with high solar intensity. Natural economic evolution would produce solar cost savings and technology improvements driven from states such as Arizona, which would then roll those gains into less sunny states. Arizona 2012 average retail rate ranks 19 out of the 50 states at 9.71 cents/kWh. The top state is Hawaii – another very sunny state who is limited in resources and whose rate averages 31.59 cents/kWh. If solar was so easy and economical, these states would be far ahead of their current levels – Hawaii less than 0.5% and Arizona slightly under 2% as percentage of total energy in 2013. Obviously, there are some economic advantages of being able to build and design effective solar technology to export to areas of need. To extract this value, it does not necessarily require the host state to have policies exceeding other states. A difference of 10% capacity factor (12% to 22%) can produce a swing of over 10 cents/kWh. I mentioned all this to point out the concern that EPA used the state RPS program as their guide to the level of renewable. However the economics and science to these RPS programs may not be reality, as politics can defy reality.
The final recommended Best System of Emission Reduction (BSER) from the EPA in the Clean Power Plan is “4. Reducing emissions from affected EGUs in the amount that results from the use of demand-side energy efficiency that reduces the amount of generation required.” This is the 3rd most impactful out of the 4 programs in terms of reducing CO2 rates.
I have worked and reviewed many demand-side energy efficiency programs. I had the opportunity to work with the Northwest Power and Conservation Council (NWPCC) and review their data, which is impressive. Demand-side energy efficiency programs should be evaluated as a resource. I have helped many utilities in enabling their power models to do this. Unlike the other 3 BSER, this one is very dependent on human behavior, and because of that, much more detail and thought needs to be examined. EPA did not go into detail. “We have not assumed any particular type of demand-side energy efficiency policy.”
The issue with demand-side energy efficiency program can be summed up with EPA’s own words “Regardless of how the energy savings of an energy efficiency measure are determined, all energy savings values are estimates of savings and not directly measured” EPA spent much time talking about evaluation, measurement, and verification (EM&V) industry given the reliance on estimates. The problem I have noticed here is we have an industry that has grown significantly from $1.6 billion in 2006 to $5.9 billion in 2011 and projected to be over $8 billion per the American Council for an Energy-Efficient Economy. As with all industry that grows that quickly there will be growing pains. The first one that comes to mind is that there are certain companies who are in all three spaces, Evaluation, Measurement, and Verification. You can see there are many companies who evaluate in one state and verify in another. This should be unacceptable practice and the commissions need better oversight of these companies. Too many incentives exist to support the ever growing DSM-EE industrial complex regardless of actual results when this happens. It is important that there are checks and balances in the EMV space to minimize these practices.
The goals set forth by EPA are done so by assuming a best practice standard for each state and then targeting that rate. “For the best practices scenario, we have therefore estimated that each state’s annual incremental savings rate increases from its 2012 annual saving rate to a rate of 1.5 percent over a period of years starting in 2017.” I am sure this is conservative for many states, but at the same time I expect just as many, if not more states, to have a much harder time hitting target. Based on their spreadsheet, by 2030, demand-side energy efficiency programs will total 380,569,493 MWh. To put that number in perspective, this is more energy used by the state of Texas, state of California, or the United Kingdom. Using the average retail rate of electricity of 9.9 cents/kWh – this would amount to over $38 billion dollars a year “wasted” by society. It is an astronomical number to imagine that society would be that inefficient on a business as usual path.
It is true, that as whole, there are energy savings that an individual consumer could not realize or value without a collective saving mechanism. The difference can typically be traced down to the value of capital and the fact that a personal decision is not always economically rationale as other factors such as feeling good, to peer pressure, are very hard to economically quantify. In these cases, programs can be developed to add more value to savings to even nudging the consumer to act good for the whole.
The extrapolation from one state to another state needs to be carefully balanced given the human connection to these programs. As I noted before, DSM is a detailed process since it focuses in on what your customer uses energy for. If your customer uses heat pumps to stay warm as their primary energy usage, implementing a large light bulb program will only get you so far compare to places like California. As weather becomes more temperate, it is easier to modify behavior since human life is not harmed. However in extreme cold or heat, energy efficiency becomes limited. The successful California experience in energy efficiency just cannot be extrapolated one for one to other states.
Programs do naturally have a natural end life. As a simple example, consider the conversion of lighting. It eventually ends. In fact, the big gains end quite soon, as you think about where and how you use lighting. Eventually the incremental lighting updates occur in less used areas such as garages to closets. The initial lighting change will be in the most used area, but the incremental change much less so. An extrapolation of those impacts needs to be carefully considered. Many EMV companies understand this so it is worrisome to extrapolate savings for so many years.
Let me pause here before I go into a can of worms in dealing with cost and benefit.
If you need help in designing and modeling your DSM programs I can help you. In addition if you need a third party to help discuss with regulators and commission your decision criteria for DSM, I can also assist in this.
Policy discussions can be beneficial when coming from a factual context without significant biases or agenda. There is no doubt in my mind policy can be an effective tool in producing positive societal benefits – it is all in the design, implementation, and regulation.
Please contact us 614-356-0484 or[email protected]
Your Inspired Energy Consultant,
David
Founder & Principal
All Energy Consulting LLC
“Independent analysis and opinions without a bias.”
614-356-0484
[email protected]
blog: http://allenergyconsulting.com/blog/category/market-insights/
#2 Clean Power Plan Assessment – Market & Engineering Perspective
Before I continue with my assessment of the Clean Power Plan, I want to reflect and comment on what I have discussed in the first post. Let me make this clear, there is NO congressional action needed to make this happen. This is all being done through the Clean Air Act.
The fact that EPA is using a rate based mechanism does not preclude it from hitting a ton reduction given this is being applied to the existing fleet. Plus, they are limiting the new plant options. The only way to exceed the tonnage barrier is to add to the denominator of the rate (lb/MWh). Energy efficiency programs (EE) and renewables can be counted to the MWh. The limits they proposed from their Excel spreadsheet are based on very aggressive and large reduction-given they are starting with the 2012 lowest gas to coal price spread. (as noted in the previous discussion) Then, they modify the coal to be more efficient plus re-dispatch more gas and then adding Nuclear, Renewable, and EE/DSM efforts to the denominator to produce state by state CO2 rate lb/MWh. Because this calculation is only on existing units, it is not likely to be able to increase significant volume of CO2 from those plants as some discuss. The rate will be highly dependent on being able to achieve and/or over achieve the Nuclear, Renewable, and DSM/EE efforts as they calculated. This leaves room for total tons of the entire fleet (new and old) to be greater, but this will not come from the existing fleet. Also, given the renewable and DSM are quite high targets, the tonnage level will not likely exceed to what they are targeting-which is “Nationwide, by 2030, this rule would achieve CO2 emission reductions from the power sector of approximately 30 percent from CO2 emission levels in 2005.”
This is a perfect transition to continue with the assessment of the Clean Power Plan. The next BSER and the most impactful block is “Reducing emissions from affected EGUs in the amount that results from substituting generation at those EGUs with expanded low- or zero-carbon generation.”
In this section, they discussed the role of nuclear. This is the smallest impact, even less than the coal unit efficiency improvement. Adding CO2 cost will likely keep many of the nuclear fleet from retiring. The re-license cost has grown for nuclear fleet given all the recent issues with nuclear. Some estimates show cost to re-license greater than 4X the cost of a brand new gas plant. Given the limited impact of nuclear, I will limit the discussion and move on to the largest piece of the puzzle, Renewable.
EPA is focused on wind and solar renewable. They note they left out biomass. The renewable piece is a tale of two calculations. The effects of the option 1 BSER, according to the EPA IPM results, are minimal on the actual renewable capacity. Less than 10% change in capacity was observed from the base to option 1. Producing a CO2 price should certainly incentivize more renewable and nuclear generation. On an annualized basis, non-hydro renewable generation is growing 2% a year. This certainly seems to be reasonable-if not conservative-given the last ten years has seen double digit growth in renewable generation. However, there is a big difference in the IPM file and the Excel spreadsheet. In the Excel spreadsheet, renewable generation is shown as almost 50% higher than the IPM option1 case. I am not sure what to make of the difference. In the spreadsheet case, it is still not unreasonable to assume a 4% growth in renewable generation in a year. This would require artificial support which could be in the form of Renewable Energy Credits (REC), CO2 price, and/or tax credits. In terms of incremental cost over the IPM model, if we assume the difference in MWh, the associated capacity factor of 0.3, and the capital cost for renewable of ~$2000/kW this calculates 63 GW at cost of $127 Billion.
My concern is more in the distribution of the renewable versus the total. EPA initially examined the renewable potential by 6 regions. In their own words: “EPA estimated the aggregate target level of RE generation in each of the six regions assuming that all states within each region can achieve the RE performance represented by an average of RPS requirements in states within that region that have adopted such requirements. For this purpose, EPA averaged the existing RPS percentage requirements that will be applicable in 2020 and multiplied that average percentage by the total 2012 generation for the region. We also computed each state’s maximum RE generation target in the best practices scenario as its own 2012 generation multiplied by that average percentage. (For some states that already have RPS requirements in place, these amounts are less than their RPS targets for 2030.) For each region we then computed the regional growth factor necessary to increase regional RE generation from the regional starting level to the regional target through investment in new RE capacity, assuming that the new investment begins in 2017, the year following the initial state plan submission deadline,153 and continues through 2029. This regional growth factor is the growth factor used for each state in that region to develop the best practices scenario. Finally, we developed the annual RE generation levels for each state. To do this, we applied the appropriate regional growth factor to that state’s initial RE generation level, starting in 2017, but stopping at the point when additional growth would cause total RE generation for the state to exceed the state’s maximum RE generation target.”
This all makes sense until you think about the market perspective and the actual reality of this approach. Historically, the areas with the greatest renewable development generally have two characteristics – high power price and/or an abundance renewable generation opportunity. The barrier to jump to alternative power source was minimal, such as the case in California compared to states with low power prices Kentucky and West Virginia. These states with much lower prices will have a greater impact in moving to a more renewable system. Their economy is not centered on high power prices. The jump to this higher value will be significant. West Virginia growth in renewable is 1000+%. In West Virginia’s case, EPA is asking the state to invest in a more expensive, but cleaner power source. If we assume the same assumption above, then WV’s needs ~3.6 GW of wind capacity with a total cost of $7 billion dollars. If we spread the cost with West Virginia retail sales over the next 20 years it would still cause a rate impact of 14%. I did a state by state analysis on this renewable piece – if you are interested email me[email protected]
Let me pause here for further digestion before moving onto the EE/DSM portion of the plan.
We can help the policy discussion in terms of running independent assessment and helping develop strategies to best plan for the future.
Please contact us 614-356-0484 or[email protected]
Your Inspired Energy Consultant,
David
Founder & Principal
All Energy Consulting LLC
“Independent analysis and opinions without a bias.”
614-356-0484
[email protected]
blog: http://allenergyconsulting.com/blog/category/market-insights/
Clean Power Plan Assessment from a Market and Engineering Perspective
There are many reviewing the recent EPA – Clean Power Plan. Many argue from a policy perspective and rarely actually review the details and the numerical results. In this discussion, I will share with you my initial takeaway from reading the 645 Clean Power Plan along with hundreds of other pages in the Technical Source Document (TSD) plus the Excel files supplied. In addition, I did use my Power Market Analysis (PMA) model to validate and cross check some of the results.
Let me first give some background to those who do not know me. I am a Chemical Engineer from the University of Texas at Austin (hook’em horns) by training, however I have spent most of my professional life in analyzing and understanding energy markets (Purvin & Gertz (now IHS), Deloitte Consulting, American Electric Power). Please don’t hold the American Electric Power experience as a foretold bias on coal. I have served on the National Renewable Energy Laboratory (NREL) technical advisory panel so I do know the issues and trends of renewable power. My fellow panel members would vouch for my impartial attitude. I am a numbers person who holds not personal bias other than the desire to optimize the numbers. Truth be told, I was a leader in the AEP organization in terms of indicating the need to diversify and support gas investments even as gas markets were soaring, as my groups long-term forecast indicated prices to settle between $5-7/mmbtu for my entire tenure at AEP (2002-2010), to the angst of many AEP colleagues. My forecasts are not driven by personal biases or political motivation, but the desire to understand and know the markets. I live by the University of Texas motto “The Truth shall set you free”.
I have approached the Clean Power Plan Assessment in a similar fashion. I am opened minded on the need and societal desires to be cleaner. Striving to have a positive or the least negative impact on the earth will always be a good intention. As long as people are clear on the cost and potential gains, I would not challenge the path society has chosen.
There is so much one can note on a 645 page plan. The document was repetitive in several places – the ironic thing is on page 581 there is a note on the Paperwork Reduction Act. I was taking my own notes as I read the document. My notes ended at 17 pages. I have reorganized my thoughts to hit the most impactful points first.
I think the very first thought that should rush into everyone minds is the rate focus EPA has. The EPA, compared to many of the previous emission reduction goals, is now pushing a rate based target (lb/MWh) vs. a tonnage limit as seen in SO2, NOx, and even the initial HG program. They do offer the option of mass based target, but clearly favor the rate based approach. This took many nights to truly understand and absorb all the nuances as to why this is the case. The first thing in order to understand this approach is to understand the rule is focused on EXISTING units and those recently under constructed. This is a key issue on why the buildings of new gas plants are not listed as an option for Best System of Emission Reduction (BSER). Currently the new gas plants will likely be limited by section 111(b) of the Clean Air Act (CAA). “In January 2014, under the authority of CAA section 111(b), the EPA proposed standards for emissions of CO2 from newly constructed fossil fuel-fired electric steam generating units (utility boilers and integrated gasification combined cycle [IGCC] units) and for natural gas-fired stationary combustion turbines.” The limits proposed for new gas plants would be an achievable solution for 24 states. The other states will have to go lower than gas plants. For this reason, I suspect the gas plants were not a BSER solution nor were they discussed for more than a few paragraphs.
The rate method also allows an “easy” way to give value and credit to EE and renewable projects. There seems to be some conflict in allowing this given the plan currently notes: “Based on the EPA’s application of the BSER to each state, the EPA is proposing to establish, as part of the emission guidelines, state-specific goals,expressed as average emission rates for fossil fuel-fired EGUs.” However by allowing EE and Renewables to modify the rate calculation, it seems to have conflicted with the above statement. The argument is made that EE and renewable generation can be attributed to the affected EGU. “A MWh crediting or adjustment approach implicitly assumes that the avoided CO2 emissions come directly from the particular affected EGU (or group of EGUs) to which the credits are applied”
EPA spent much time focused on their BSER suggestions laid out in four blocks:
“1. Reducing the carbon intensity of generation at individual affected EGUs through heat rate improvements.
2. Reducing emissions from the most carbon-intensive affected EGUs in the amount that results from substituting generation at those EGUs with generation from less carbon-intensive affected EGUs (including NGCC units under construction).
3. Reducing emissions from affected EGUs in the amount that results from substituting generation at those EGUs with expanded low- or zero-carbon generation.
4. Reducing emissions from affected EGUs in the amount that results from the use of demand-side energy efficiency that reduces the amount of generation required.
Based on that evaluation, the EPA proposes that the combination of all four building blocks is the BSER”
The EPA first BSER seems to be somewhat of a red herring. They spent quite some effort only to conclude a small impact. I oversaw a paper on power plant efficiency for the National Petroleum Council Hard Truths. A very similar conclusion is shown in that only a few percentages are likely to come from an existing unit improvement. This impact is the smallest by many percentages compared to blocks 2-4. I do have concerns in their extrapolation for opportunities for improvement in the existing US coal fleet. In their spreadsheet model, they take 2012 generation and assume a 6% improvement. The issue I quickly see with this math is the fact the likely remaining coal units that are running after 2020+ are likely the best of the best coal units to begin with. These coal units did not get to be the best ignoring best practices, therefore the remaining coal units will have much less opportunity to improve heat rates compared to the units that will likely be retiring (From EPA own analysis 72 GW 2016 to 101 GW by 2030 (cumulative)).
The second block is the most interesting block in my mind. It is also the second most impactful of the blocks only few percentages away from #3. When dispatched is discussed, one should quickly jump to market conditions. A dispatch of power plants is largely driven by load and fuel commodity price relationships. The first issue, largely perhaps by coincidence and unintentional is their use of 2012 data. Out of all the years one could choose, 2012 is probably the LEAST likely year in the future in terms of commodity price relationships. The spread between coal and gas prices was less than $0.40/mmbtu. Nowhere in the forecast is this price spread being predicted. In the models being used, the spread is closer to $3/mmbtu. This produces an abnormal level of coal generation to start their calculation of targeted rate. In order to get gas units to perform in the 70% utilization range, retirement of existing coal unit and/or the spread of the fuel cost need to narrow. Using a carbon cost will narrow the economics. I did run a 2016 carbon case with $30/ton, and it did produce NGCC utilization rates close to 70%. Therefore there is an agreement with the statement “For the scenario reflecting a 70 percent NGCC utilization rate, comparison to the business-as-usual case indicates that the average cost of the CO2 reductions achieved over the 2020-2029 period was $30 per metric ton of CO2”. What I will be concerned with is the statement “Projected wholesale electricity price increases over the same period were less than seven percent in both cases, which similarly is well within the range of historical electric price variability” I think they are referring to the gas price change impact due to more demand. However the question really should be the impact of making the gas units 70% utilized which is done by adding the $30/ton carbon cost. The 7% increase would seem very unreal with the math of only dispatching difference and carbon of $30/ton. When I model 2016 with and without $30/ton carbon, it results in significant price increases. PJM-West prices rise 50%. In terms of total system impact, the 2016 case without carbon is showing total US energy revenue for all the plants of $168 Billion. Adding carbon increases the energy revenue to $253 Billion, an increase of 51%. It is possible to lower the cost as certain markets are closed system and may not pass the cost directly to the consumer. However, market principle for the majority markets would apply and this is increasing as more utilities de-regulate their generation. Another potential for price increase mitigation could be if they model more than block 2 and included renewables. Renewable PPA deals do collapse the wholesale market, but those cost show up on the retail prices. However they discussed this in the block 2 discussion. There are regions where prices move up only 17%, but, on average, prices are up 50%. This brings up another can of worms in terms of state impacts from one to another. Out of the hub reporting I am looking at, Indiana will be the biggest hit. I am at loss to understand the minimal discussion of energy price impact of $30/ton carbon cost. A true impact study should show the case where coal units are running and then adding carbon cost to essentially push out coal units should be the comparison. They do note the multi-pollutant benefits, counter to that they should also identify the multi-pollutant cost by modeling a business as usual case (no MATS, CSAPR, CPP, etc…).
There is much to digest here so I will pause before discussing blocks 3 & 4.
We can help the policy discussion in terms of running independent assessment and help develop strategies to best plan for the future. Please contact us 614-356-0484 or [email protected]
Your Inspired Energy Consultant,
David
Founder & Principal
All Energy Consulting LLC
“Independent analysis and opinions without a bias.”
614-356-0484
[email protected]
blog: http://allenergyconsulting.com/blog/category/market-insights/


