Energy Efficiency Reports – A tale of two bias reports

Before I jump into this blog, I want to state some obvious statements. Energy is a means to an end. The use of energy typically increases the well-being of the individual. Being more energy efficient produces better productivity by freeing capital to be used elsewhere. No one strives to be wasteful, but the law of entropy requires work for us to be more efficient. We do have thresholds where our behavior (e.g. laziness) will change.
I came across this report/blog by the CO2 Scorecard supposedly debunking the numerous reports/articles not shining a very bright light on efficiency – in particular the Breakthrough Institute (BTI) report. I will say both reports did a fine job in highlighting various variables important in understanding the efficacy and impact of efficiency. The CO2 Scorecard tries to compare various micro topics with very broad BTI topic. At the same time the BTI did not stick to their broad topic of energy consumption by selecting individual cases such as lighting to demonstrate their concerns. Each alluded to Jevons Paradox, but did not follow the true principle/theme Jevons Paradox. Clearly Jevons noted resources. Electricity is not a direct resource, but a creation from resources, which is later used as a resource. It is the underlying resources which derive energy consumption – British Thermal Units (Btu). Saving in electricity does not necessarily conclude savings in resources and/or energy use, which I will show below. Changes in the use of electricity will have micro impacts which are lasting as the CO2 Scorecard noted on refrigeration, but this does not change the macro premise of increasing energy use as you become more efficient.
CO2 Scorecard certainly presented more graphs and supposed data supporting their thesis that efficiency by itself will reduce energy consumption. I will disagree. Let me first state, I am not funded for this analysis, therefore I can only delve so much into this – though if someone would like to fund me I would be glad to be more thorough – but I believe the charts and the data I have put together should bring some doubt to the CO2 Scorecard claims. First I will address my greatest pet peeve from the champions of efficiency – using California as the example for the rest of the country. There is a reason California is the most populated state and it’s not because of the local government, taxes, and friendly people – it’s the weather in concert with its natural beauties (beaches, forest, etc…). The term Sunny California is not even close to the saying Sunny Texas. Overall the winters are mild compared to Ohio and the summers are mild compared to Texas. The primal use of energy is for climate control from the extremes and for cooking. With California not observing any extreme temperatures, it should be no surprise; they are the least energy intensive state.
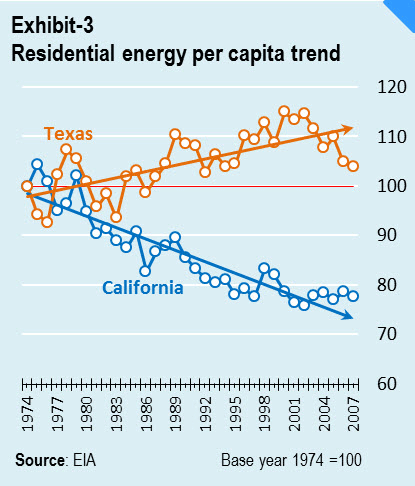
CO2 Scorecard shows the following graph in their report to support their claim that efficiency programs can have significant impact on energy use. Once again, I will agree that efficiency program can have micro impacts by themselves, but do not have significant sustainability for a macro reduction of energy without other factors such as price.
Let me present some charts that the CO2 Scorecard folks could have easily added into their analysis, if they truly wanted to be empirical.
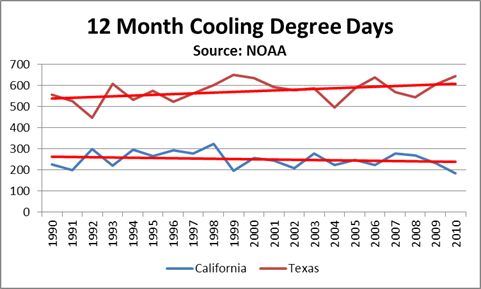
Cooling degree days represents the days above 65 degrees Fahrenheit. The data can be obtained from the National Oceanic Atmospheric Administration (NOAA) who manages the National Climatic Data Center. If you plan to use their data be aware of each of the drop downs and the meanings. The cooling degree chart actually does show a warming trend for Texas for the last twenty years, whereas California has been showing a cooling trend. This is skewing the chart CO2 Scorecard presented. Each Texan had to use more electricity to maintain the corresponding comfort from last year, whereas Californians improved their energy use as the weather only got better – life is unfair.
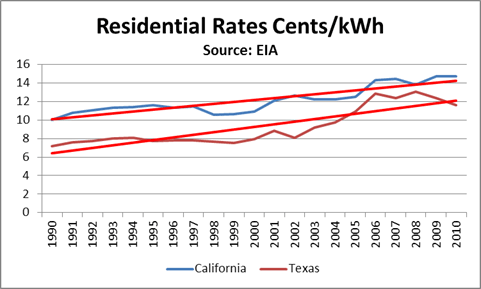
Another chart accessible to CO2 Scorecard, which they failed to delve into, is the Residential retail price trend. Price is the missing piece in many efficiency discussions. Real sustained energy reduction can be obtained with the combination of efficiency and price increases.
Texas was catching up to California, but this will not likely occur as natural gas prices have fallen. California’s sustained higher prices have resulted in greater incentives for Californians to save each kWh.
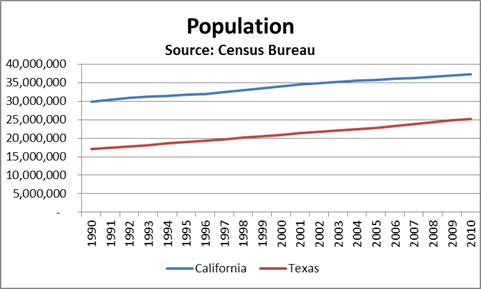
Population trend was also an important element in producing the digression in energy use per capita.
Texas was growing twice as fast as California for over the last 20 years. My northern friends set their summer thermostats between 68-72 whereas my Texas natives live with 78-80. Clearly a subset of the growing population in Texas was going to use more energy.
Micro vs. Macro and a Question of Morality
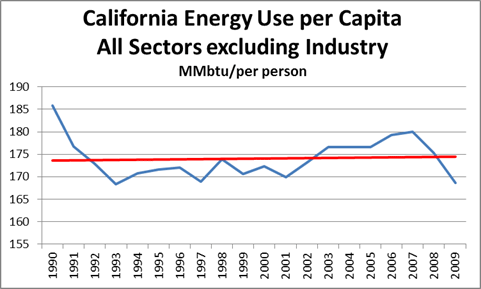
I think both the CO2 Scorecard and BTI mixed up micro elements with macro discussion of energy reduction. I will use the California case to prove my point. As Californian’s reduced their use in Electricity in the residential sector, this enabled the Californians to re-allocate their capital for more consumption elsewhere. This is the nature of our economy – consumerism. This can be seen in the form of driving more, shopping more, and/or living with more things. The chart below presents this to be true:
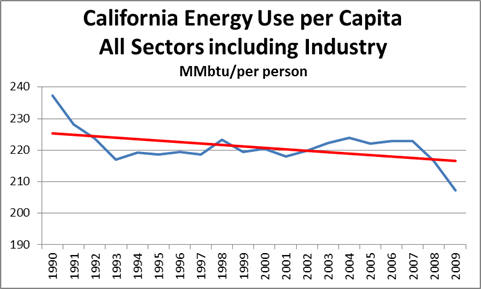
The positive note is the consumption trend line is quite flat, but this is likely due to the cost of living in California and the exporting of energy use (later discussed). I have excluded industrials because of the national and local trend to push manufacturing away. If I put it back into the chart, the amazing efficiency trends re-appear.
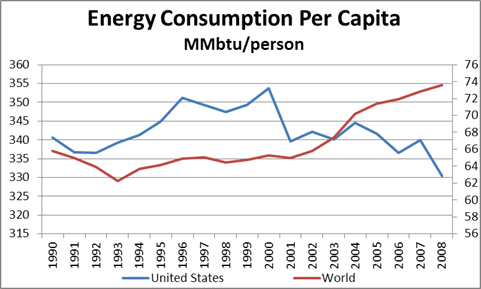
The efficiency trend with industrial is evidence of the micro vs. macro trend. Energy is a global demand as we each strive to live better. Resources making energy is in demand worldwide. If we use less, most likely others would benefit from our reduction in the demand pressure on that resource. At the same time, we cannot take credit for a reduction of energy when we have decided others to make our widgets and we only track the energy consumption of using the widgets versus the energy cost of making the widgets.
The above chart shows the manufacturing shift and also the electrification of people who have no access to electricity. For us in the western world it is almost impossible to imagine not having access to electricity. Yet, 1.4 billion people in the world still do not have electricity. This is 1 in 5 people in the world without electricity.
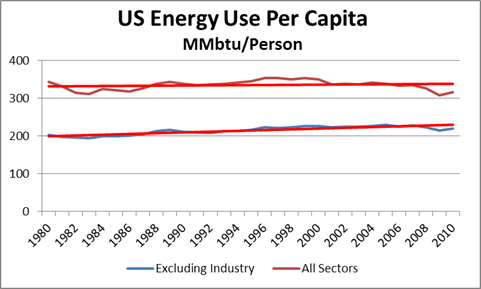
Even in a micro view of only the US, there is evidence the shift of California energy use was partially shifted to other states in the US.
The trend line in energy use is still climbing for both lines, less so with all sectors included. We are still increasing our energy even though we have become more efficient.
I see a large value in efficiency improvements, but it is not on the basis of reducing energy. It is on the basis of freeing capital to allow other forms of investment in matters not focused on the means, but the ends. We can see this has happened by what CO2 Scorecard emphasized, the falling use of energy for refrigeration in households. In fact, residential use of total electric consumption from refrigeration, space cooling, space heating, water heating, freezers, cooking, and indoor lighting now represents only half of the energy consumption as compared to 1980 when those categories represented 90% total residential electric consumption. Some of us now use more energy on our widgets than our essentials and our ability to do this can largely be attributed to several efficiency programs. On a moral basis, we have helped the rest of the world to more easily obtain the use and value of energy by being more energy efficient. It is almost a mass balance. We will use resources or someone else will, unless there are price drivers preventing the pursuit of living better.
Another moral question we need to balance locally, efficiency programs are regressive in nature. As an example, a subsidy from the utility to insulate housing must be paid for by the rate payers. A subsidy typically means a partial payment. Those who likely have free capital to spend – versus living paycheck to paycheck – are more affluent. The affluent will likely take advantage of the subsidy. The utility rates in the near term will rise from the subsidy itself and also the reduction of energy since the utility model is designed to recover cost. If the system uses less energy the utility must charge more per energy use to be whole. Those who do not take advantage of the subsidy will be impacted twice as much.
As with many issues in the energy industry, things are not black and white. However, if we maintain an open-mind to learn and change our views, we can learn to progress and make better decisions. I am open for criticism for my analysis. Given my time commitment and lack of funding, I certainly could have overlooked a few critical items. My point in writing this is not to produce a conclusive report on this subject, but to point out some critical elements I see missing in the various discussions on efficiency. This writing should not leave anyone to decide to be against efficiency, but to understand the value of efficiency and to help accurately color the discussion on the various efficiency programs.
If you like this type of analysis, please consider funding studies for me to do or hiring me as consultant.
We positively and evocatively challenge the current thinking involving any aspect of energy use. We look for projects that offer meaningful, transformative, with impactful outcome to the marketplace or society (see projects).
Please consider All Energy Consulting for your consulting needs.
Your Energy Consultant,
David K. Bellman [email protected] 614-356-0484

